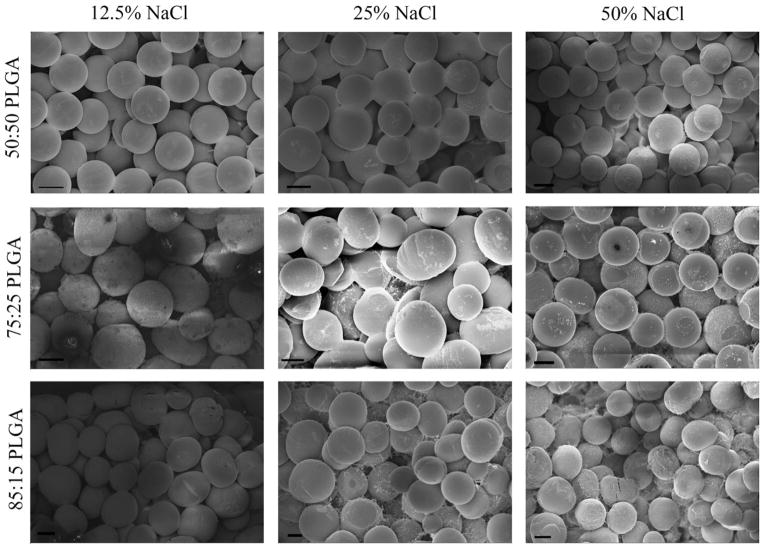
FIGURE 3.
SEM images of scaffolds with different salt concentrations (0, 12.5, 25, and 50% NaCl) and different lactic/glycolic acid ratios (50:50, 72:25, and 85:15 PLGA). Although differences in degree of sintering were difficult to discern among the PLGA ratios at a given salt concentration, it was readily apparent that there were more void spaces present with the higher salt concentration groups. It is noteworthy that the sizes of the salt particles and the microspheres were very similar. Scale bars = 100 μm. CO2 exposure: 1 h, applied pressure: 15 bar, intrinsic viscosity: 0.34–0.35 dL/g.

