
Fig. 1.
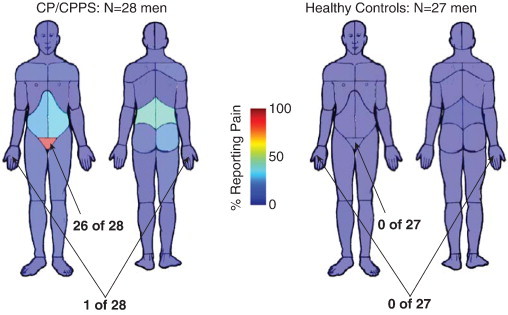
Spatial distribution of CP/CPPS pain in the MAPP cohort. Body maps of pain for the MAPP patients with CP/CPPS and MAPP healthy controls (HC) used in the neuroimaging analysis. Each participant filled out a body map indicating yes or no to pain in the 45 body regions define by the image above. Color maps indicate the percentage of participants indicating pain in each region in each cohort. 26 of 28 men with CP/CPPS indicated pain in the pubic/perineal region, but only 1 of 28 men with CP/CPPS indicated pain in the right hand. By contrast, none of 27 HC indicated either pubic/perineal pain or pain in the right hand.