Figure 2.

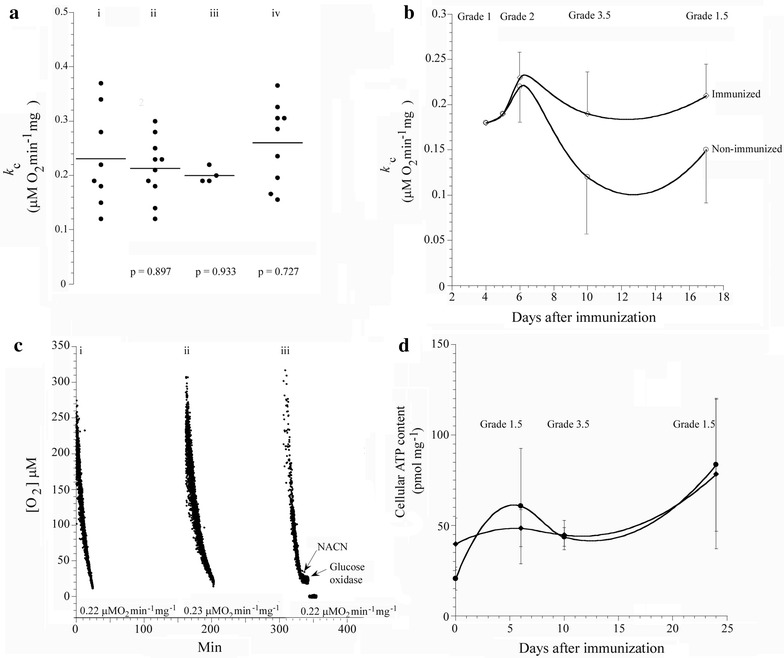
Spinal cord tissue respiration in immunized and non-immunized rats. a A summary of all k c values (involving 33 rats) as a function disease grade for (i), immunized DA with grade 1–2 disease (ii), immunized DA rats with grade 3+ disease (iii) and immunized but resistant AO rats (iv). b Representative experiment of cellular respiration in immunized and non-immunized DA rats with different grades of disease showing the values of k c as a function of days after immunization. c Representative runs of O2 consumption by spinal cord tissue from non-immunized (i), immunized with grade 1-2 disease (ii) and immunized with grade 3+ disease (iii) DA rats. Addition of 10 mM NaCN and 50 μg ml−1 glucose oxidase are shown. Rates of respiration (k c, in μM O2 min−1 mg−1) are shown at the bottom of the runs. d Cellular ATP content in immunized DA and AO rats on days 6, 10 and 24 after immunization. The error bars are standard deviations (n = 3 independent samples).
