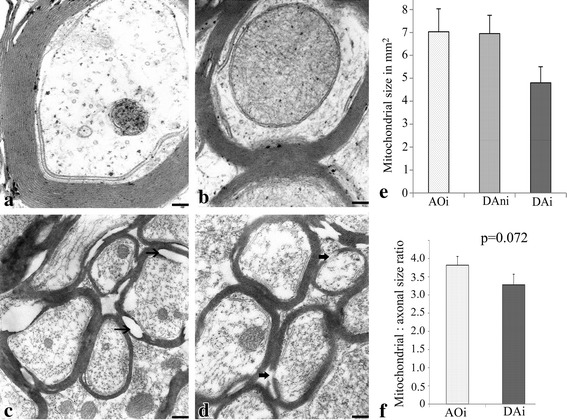
Figure 5.

Ultrastructural features of nerve fibres of rats at the peak of clinical disease of EAE. Electron micrographs of sections of the spinal cord of non-immunized DA (a), immunized AO (b), and grade 3 diseased DA (c, d) rats (n = 4; 3 non-contiguous grids). Note the normal myelination of fibres in spinal cords of both non-immunized DA and immunized AO rats. Note also the evidence of demyelination in c and d (thin arrows) including splitting of the myelin sheath either at the major dense line or at the intraperiod line. Also present are areas where there seem to be stripping of the nerve fibres of myelin (thick arrows). e A graph comparing the size of mitochondria in AO with that in DA spinal cords. Note that as shown in e, despite the normal appearance of mitochondria in axons of diseased DA rats (DAi), they are significantly smaller (p < 0.005) compared with those in the axons of immunized AO (AO) and non-immunized DA (DAni) rats. Note also that there is no significant difference in the ratio of the mitochondrial:axonal sizes in the immunized diseased DA and resistant AO rats (p = 0.08; f). Bar a, b 0.1 μm; c, d 0.5 μm.
