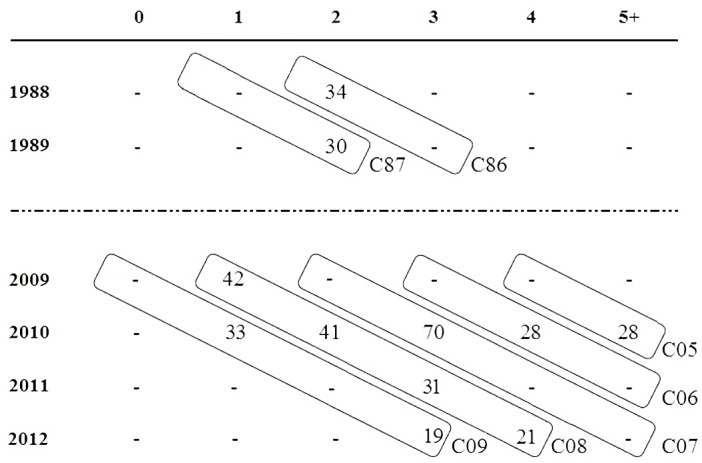
Fig 2. Diagram of the defined cohorts, based on the age of the individuals.

Columns indicate age of individuals and rows year of capture. Values inside tables are the number of individuals for each age/year combination. Seven cohorts were defined by diagonal frames whose names were based on the hatching year of the individuals: C86, C87, C05, C06, C07, C08 and C09.
