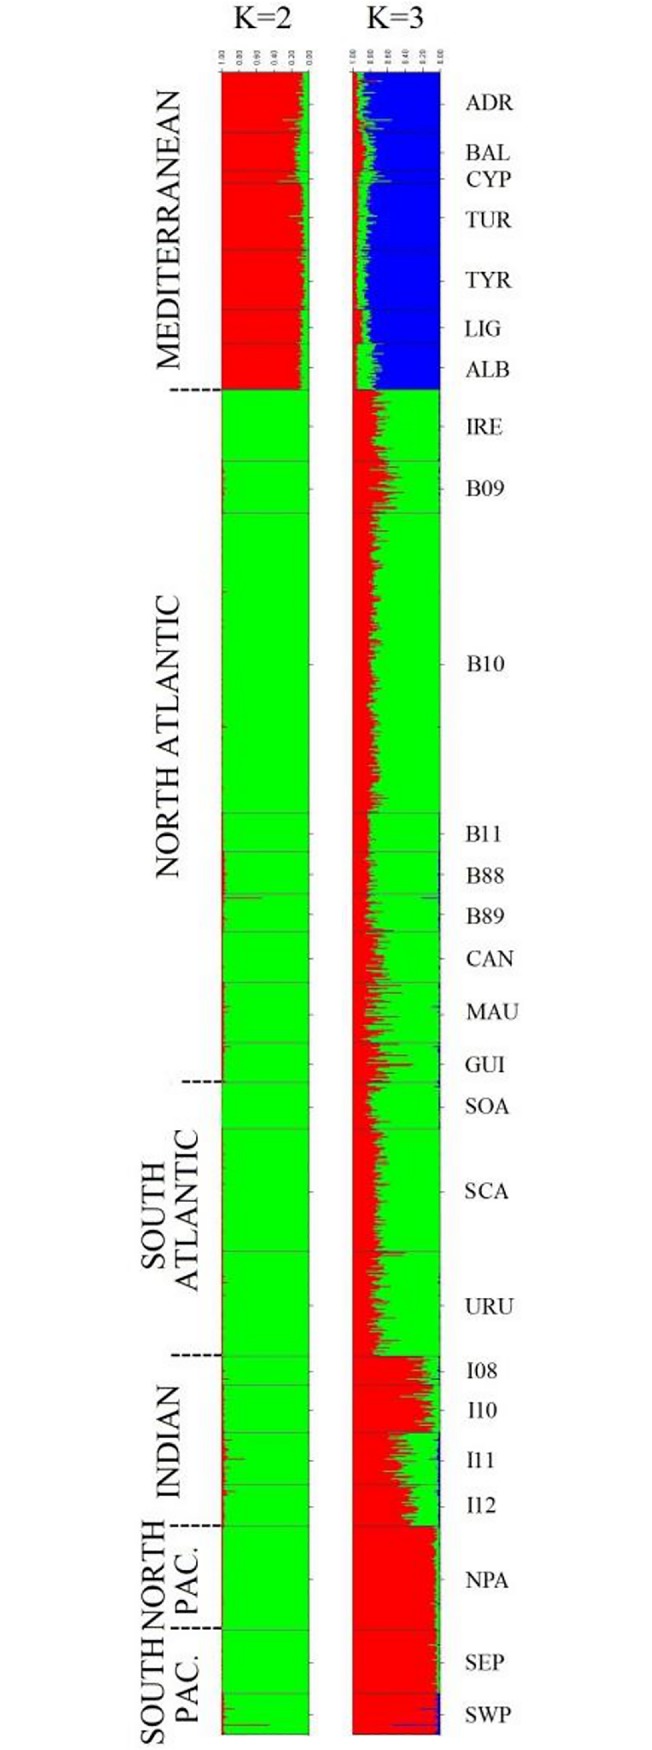
Fig 4. Individual clustering analysis implemented with STRUCTURE software for K = 2 and K = 3.

Each vertical bar represents an individual. The 26 locations are separated by horizontal continuous black lines, and the currently accepted 6 stocks are separated by discontinuous horizontal black lines. The color proportions of each bar correspond to individuals’ estimated membership fractions of each of the clusters. Sample abbreviations are as defined in Table 1.
