Figure 4.
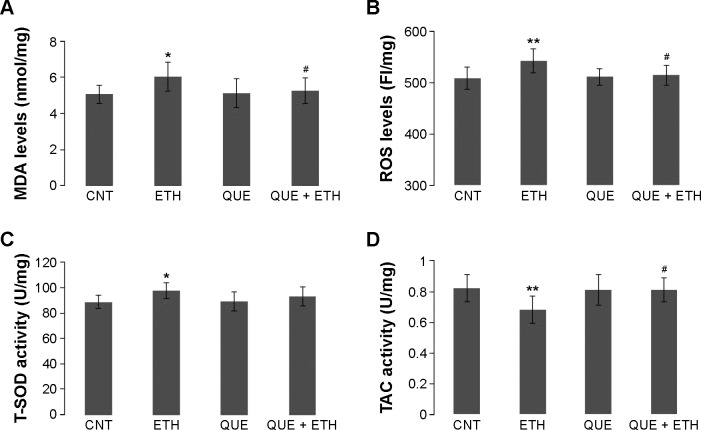
Coadministration of quetiapine blocked the ethanol-induced oxidative stress in the hippocampus of rats.
Notes: (A) Quetiapine blocked the ethanol-induced increase in MDA; (B) Quetiapine blocked the ethanol-induced increase in ROS; (C) Quetiapine blocked the ethanol-induced increase in T-SOD; (D) Quetiapine blocked the ethanol-induced decrease in TAC. Rats were killed by decapitation. Their brains were quickly removed and the hippocampus tissue samples were processed for biochemical analyses. Data are expressed as mean ± SEM. *P<0.05, **P<0.01 (compared to CNT); #P<0.05 (QUE + ETH versus ETH).
Abbreviations: CNT, controls; ETH, ethanol; FI, fluorescence intensity; MDA, malondialdehyde; QUE, quetiapine; QUE + ETH, quetiapine plus ethanol; ROS, reactive oxygen species; SEM, standard error of mean; TAC, total antioxidant capacity; T-SOD, total superoxide dismutase.

