
Fig. 5.
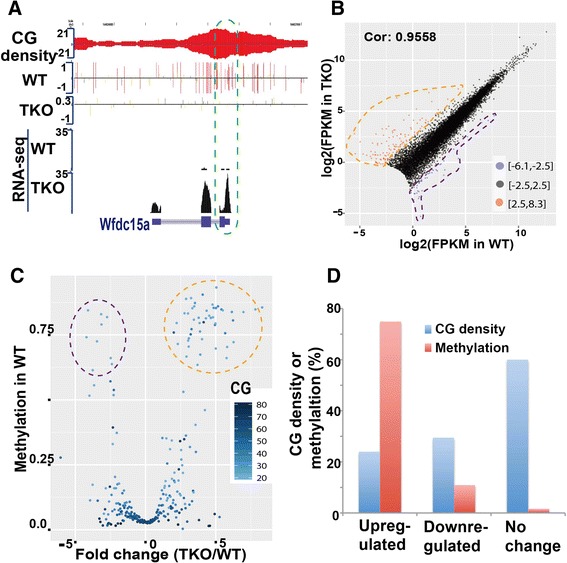
Global hypomethylation leads to expression changes of genes with low CG density at promoter regions. a Wfdc15a, with low CG density, was induced in TKO cells. b Correlation of gene expression in WT and TKO cells. Genes (n = 13,436) with FPKM >0 in both samples and FPKM sum of two samples >1 were included in the analysis. Up- and down-regulated genes with log2-transformed fold change >2.5 or < −2.5 are shown as red or blue dots, respectively. c Genes with high methylation and low CG density in promoters display significant changes in gene expression. The genes shown in panel (b) were cut into 500 equal-length subgroups according to expression fold change between WT and TKO cells. The median fold change in each subgroup was plotted against overall methylation in the same subgroup. CG number in each subgroup is shown by blue color intensity. d CG density and methylation rate (in WT cells) of genes with up-regulated, down-regulated, or unchanged expression around the TSS (500 bp up- and downstream)