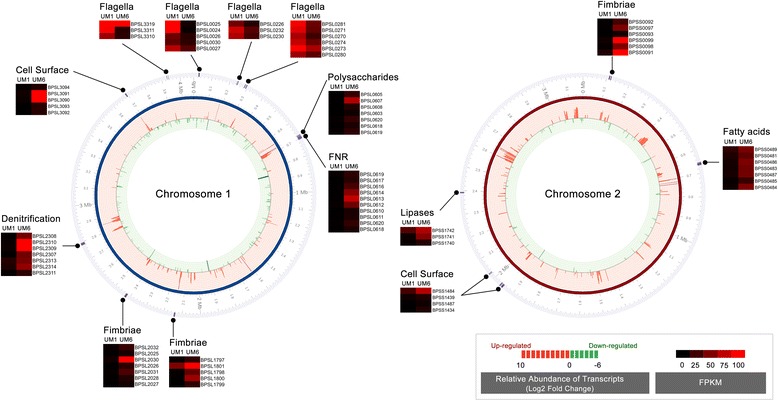
Fig. 3.

Alteration of surface composition and regulation of anaerobic respiration contribute to B. pseudomallei biofilm phenotype. Transcript expression of log2 fold level are depicted by the histogram in the inner-most ring of the circular maps. The height of the bars correspond to the degree of expression level. Genes uniquely expressed in UM6 and UM1 are coloured in dark red and dark green, respectively. Red and green bars represent up- and down-regulation in relative expression levels, respectively. Hierarchical clustering of B. pseudomallei UM1 (low biofim producer) and UM6 (high biofilm producer) expression profiles according to functional categories. The heat maps indicate the gene transcripts expressed as FPKM. Genes whose expression did not change are coloured in black
