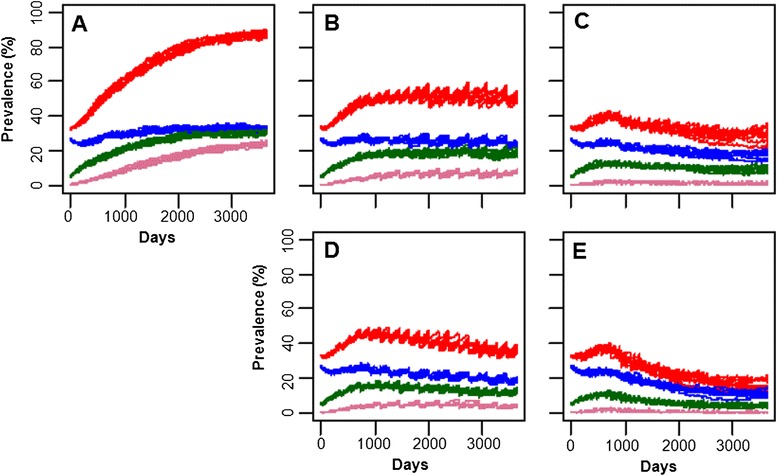
Figure 4.

Population dynamics of JD in a dairy farm simulated by the JD agent-based model. A: No testing; B: ELISA (once/year); C: EVELISA (once/year); D: ELISA (4 times/year); E: EVELISA (4 times/year). Red: Total infected animals; Blue: Exposed animals; Green: Low shedding animals; Purple: high shedding animals.
