
Figure 8.
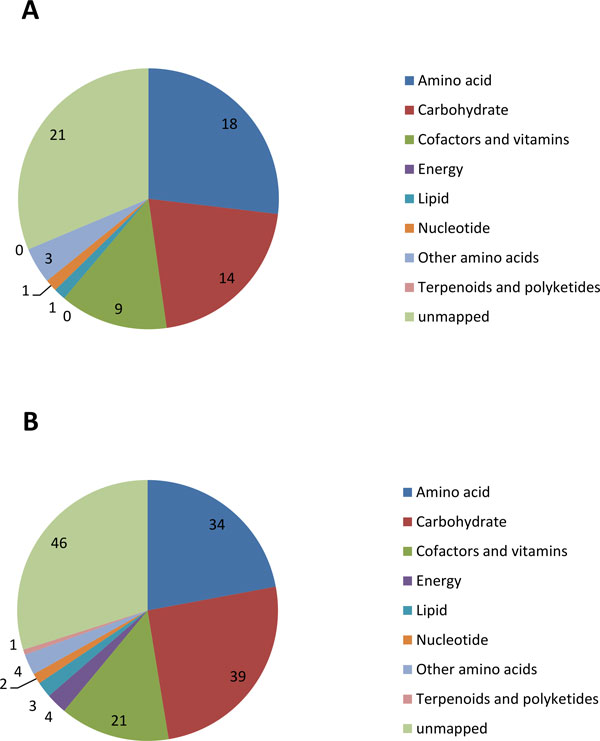
Number of Obesity and IBD enzymes in each of the major KEGG pathway categories. (A) Number of significant (p-value < 0.05; Fisher Exact Test) enzymes from obese vs. lean subjects in each major pathway categories (B) Number of significant (p-value < 0.05; Fisher Exact Test) enzymes from IBD vs. Non-IBD subjects in each major pathway categories.