

Abstract
Herein we report the first serum insulin voltammetric immunosensor for diagnosis of type 1 and type 2 diabetic disorders. The sensor is composed of multiwalled carbon nanotube-pyrenebutyric acid frameworks on edge plane pyrolytic graphite electrodes (PGE/MWNT/Py) to which an anti-insulin antibody was covalently attached. The detection of picomolar levels of serum insulin binding to the surface antibody was achieved by monitoring the decrease in voltammetric current signals of a redox probe taken in the electrolyte solution. This method offered a detection limit of 15 pM for free insulin present in serum. This detection limit was further lowered to 5 pM by designing serum insulin conjugates with poly(acrylic acid)-functionalized magnetite nanoparticles (100 nm hydrodynamic diameter) and detecting the binding of MNP-serum insulin conjugate to the surface insulin-antibody on PGE/MWNT/Py electrodes. When tested on real patient serum samples, the sensor accurately measured insulin levels. To our knowledge, this is the first report of a voltammetric immunosensor capable of both diagnosing and distinguishing the type of diabetes based on serum insulin levels in diabetic patients.
Diabetes is a metabolic disorder in which the glucose metabolism is decreased either due to deficient production of insulin in the pancreas (type 1 or juvenile diabetes) or to lack of response by cells to the presence of insulin (type 2 or insulin-resistant diabetes). The 2012 Fact Sheet released by the American Diabetes Association stated that nearly 29 million adults and children in the United States had diabetes and about 86 million people were estimated to be prediabetic (a condition before type 2 diabetes). The number of people who are prediabetic has also been found to correlate with the obesity rates.1 Diabetes-related complications include retinopathy and heart and kidney failure. Due to these life threatening impacts, a considerable amount of research is focused on the diagnosis and management of various diabetic disorders.
Insulin is a polypeptide hormone that is vital for glucose metabolism. By diagnosing the levels of insulin, one can predict the type of diabetic condition or insulinoma.2–4 Because levels of insulin in blood serum can be on the order of picomolar, even under healthy conditions, highly sensitive assay methods are necessary. The current insulin detection methods, such as enzyme-linked immunosorbent assay (ELISA), radioimmunoassay, and chemiluminescence immunoassay, are time-consuming, tedious, and require expensive chemically labeled secondary antibodies and radioisotopes.5–7 Hence, complementary methods that possess simplicity, high sensitivity, and selectivity for detecting diabetes-relevant serum insulin levels would be quite useful for the onset diagnosis of growing type 1 and type 2 disorders to provide better treatment outcomes.
The noncovalent functionalization of carbon nanotubes (CNT) by π–π stacking with pyrenyl compounds is very unique in retaining the innate electronic properties of CNT and in providing large, conductive surface area for high density covalent attachment of enzymes and proteins for biosensing and biocatalytic applications.8–17 In the present study, we report the first voltammetric immunosensor featuring electrodes modified with MWNT-pyrenyl units for directly diagnosing type 1 and type 2 diabetic conditions in patients based on simple redox signals. The normal concentration of insulin in blood-serum under a fasting condition is ~50 pM,18 whereas concentrations <50 pM and >70 pM are typical of type 1 and onset of type 2 diabetes, respectively.19–21 Therefore, immunosensors that can measure serum insulin in the picomolar concentration by a simple voltammetric monitoring of current signals are useful for clinical applications.
Wang et al. prepared carbon nanotubes for direct electrochemical detection of insulin in buffer with a detection limit of 14 nM.22 The deposition of nickel oxide nanoparticles on nafion-modified MWNT, chitosan-MWNT, CNT-nickel–co-balt oxide/nafion, and ruthenium oxide-CNT composites enhanced the electrocatalytic activity and resulted in detection limits in the nanomolar range for insulin in buffer.23–25 An aptamer-based immunoassay also has been demonstrated for nanomolar insulin detection on graphene oxide (GO)-modified electrodes.26 Unfortunately, many of these systems were employed for insulin detection in simple buffered solutions that do not meet the clinically required sensitivity levels in complex body fluids such as serum.
An electrochemical sensor fabricated using MWNT and molecularly imprinted-polymer onto a pencil graphite electrode was shown to detect insulin in buffer and in serum with a LOD of 18.6 pM.27 However, this study involved tedious acid treatment of the MWNT (100 °C, 12 h) and time-consuming filtration and surface modification steps (~80 h in total) before detecting insulin. A recently reported amperometric immunosensor utilizing MWNT-poly(pyrrole propionic acid)-composite coated on a glassy carbon electrode detected subpicomolar levels of insulin-like growth factor1 (IGF1) in human serum. Nonetheless, this sensor required chemically labeled expensive secondary antibodies and a redox mediator (catechol) to detect insulin.28 Very recently, we reported a label-free, dual-mode immunosensor constructed on gold-coated quartz crystals for detecting serum insulin levels based on changes in oscillation frequency and charge transfer resistance.29 We propose that adding the voltammetric mode of detection platform will be advantageous as clinical assays featuring multiple independent detection features can offer better assessment and diagnosis of disease markers.
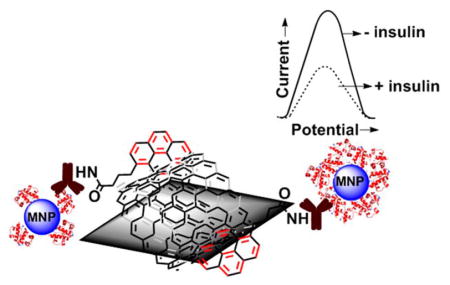
Figure 1 illustrates the voltammetric immunosensor designed in this study for diagnosing and distinguishing type 1 and type 2 diabetes in patients. The edge-plane pyrolytic graphite electrodes (PGEs) were modified by π–π stacked MWNT with 1-pyrenebutyric acid units (denoted as PGE/MWNT/Py) to covalently immobilize anti-insulin antibody and detect insulin.
Figure 1.

Schematic design of immunosensor for insulin detection in patient serum.
EXPERIMENTAL SECTION
Reagents and Materials
Type 1 and type 2 diabetes patient serum samples were purchased from BioreclamationIVT (Westbury, NY). Multiwalled carbon nanotubes (MWNT, purity 99.1%) were a gift from SouthWest Nano-Technologies Inc. (SWeNT, Norman, OK). 1-Ethyl-3-(3- (dimethylamino)propyl)carbodiimide (EDC) and N-hydroxysuccinimide (NHS) were obtained from Thermo Scientific. Poly(acrylic acid)-functionalized magnetite nanoparticles (MNP, 100 nm hydrodynamic diameter) were purchased from Chemicell GmbH (Berlin, Germany). 1-Pyrenebutyric acid (Py), monoclonal mouse anti-insulin antibody (Abinsulin), bovine serum albumin (BSA), recombinant human insulin from yeast, human serum, and potassium ferrocyanide(II) trihydrate were purchased from Sigma-Aldrich (St. Louis, MO). Potassium ferricyanide(III) was purchased from MP Biomedicals LLC (Solon, OH) and fluorescein isothiocyanate (FITC)-labeled insulin (FITC-insulin) was from Nanocs Inc. (New York, NY). Antibody label-based serum insulin sandwich type enzyme-linked immunosorbent assay (ELISA) kit was purchased from Mercodia (Uppsala, Sweden).
The pyrolytic graphite block (1″ × 1″ × 0.5″) was obtained from Momentive Performance Ltd. (Strongsville, OH) from which the disks of edge planes were prepared in our machine shop (geometric area 0.07 cm2). The monothiolalkanepoly(ethylene glycol)-carboxylate [HS– (PEG)6–COOH] and monothiolalkane-poly(ethylene glycol)–OH [HS–(PEG)3– OH] were obtained from SensoPath Technologies (Bozeman, MT). Gold-coated quartz crystal resonators (geometric area 0.2 cm2) were purchased from International Crystal Mfg. (Oklahoma City, OK). All other chemicals were high-purity analytical grade.
Apparatus and Instrumentation
A Nicolet iS50 Fourier transform infrared spectrometer (FTIR, ThermoScientific) was used to characterize the covalent attachment of antibody on PGE/MWNT/Py electrodes. The surface morphology of the PGE/MWNT/Py immunosurface was imaged by scanning electron microscopy (SEM, Model: JEOL JXM 6400). For imaging the topography of the immunosensor surface, a Veeco Nanoscope-IV multimode atomic force microscope (AFM) was used in the tapping mode and the surface roughness was obtained by using the Nanoscope IV (Veeco), software version 5.30r3.Sr3. The fluorescent images of serum FITC-insulin bound to MNP were obtained by the Leica TCS SP2 confocal microscope. Particle size measurements were performed on a high-performance particle sizer instrument (HPPS 5001, Malvern Instruments, Worcestershire, U.K.).
Optical density for ELISA estimation of serum insulin samples was determined using a BioTek Synergy H1 Plate Reader (Winooski, VT). Cyclic and square wave voltammetry studies were conducted using a CHI 6017E electrochemical analyzer (CH Instruments, Austin, TX). Quartz crystal microbalance (QCM) measurements were made in an eQCM instrument (Gamry Instruments, Warminster, PA). The electrochemical setup comprised of an Ag/AgCl reference electrode (1 M KCl), a Pt-wire counter electrode, and various concentrations of serum insulin-bound PGE/MWNT/Py-Abinsulin/BSA as working electrodes (where “/” denotes a noncovalent interaction and “-” denotes a covalent linkage). All measurements were performed in phosphate buffer saline (PBS), pH 7.4 at room temperature.
Immobilization of Serum Insulin on Magnetite Nanoparticles
The procedure for attaching standard serum insulin solutions and patient serum samples onto poly(acrylic acid)- functionalized magnetite nanoparticles (MNP) was similar to our recent report.29 Briefly, 20 μL of MNP (0.5 mg, ~9 × 10¹¹ particles, Chemicell Inc.) were treated with 150 μL of freshly prepared EDC (0.35 M) and NHS (0.1 M) mixed solution and gently rotated for 10 min to convert the –COOH groups of MNP to amine reactive N-succinimidyl esters. The supernatant containing the unreacted EDC/NHS solution was removed by applying a magnetic field from a magnet, and the activated MNP was suspended in 250 μL of PBS, pH 7.4. Then, 250 μL of different concentrations of standard human insulin solutions prepared in serum were added to the activated MNP, resulting in the final serum composition of 50% in the mixture.
The reaction mixture tubes were rotated for 2 h at room temperature to allow binding of insulin to MNP. Insulin has two surface Lys residues (PDB: 3V19) with free side chain amine groups which can bind covalently to the –COOH-activated MNP. In addition, the features of secondary interactions between insulin and MNP and the binding of serum proteins to MNP are possible. The free serum solution was separated from the MNP-serum insulin reaction mixture by applying the magnetic field from a magnet and removing the supernatant serum by using a micropipette. The obtained serum insulin-bound MNP was washed twice with 100 μL of 1% BSA in PBS (PBS-BSA) and then resuspended in 100 μL of fresh PBS-BSA solution.
Similarly, the FITC-labeled insulin was prepared in serum and conjugated to MNP in the dark for characterization by confocal microscopy using an Ar-ion laser at 488 nm. In addition, we prepared insulin in the buffer and conjugated to MNP as a positive control to perform the confocal imaging, particle size measurements, and also to test in the designed voltammetric immunosensor. This buffer insulin-MNP conjugate is free of any interferences arising from serum proteins and thus will aid in assessing the physical properties of the serum insulin-MNP conjugate and the associated extent of signal responses in the immunosensor.
Fabrication of Immunosensor Electrodes
The electrode fabrication was performed by a procedure similar to that described in our prior reports.16,17 Briefly, PGE electrodes were freshly polished on a P320 grit SiC paper, sonicated in ethanol for 30 s, and then in water for 30 s, and finally dried under nitrogen. A dispersed solution of MWNT in dimethylformamide (1 mg mL−1 in DMF) was prepared by ultrasonication for 4 h at room temperature. From this dispersion, 10 μL was drop-coated on a 3 mm diameter PGE electrode and dried at 60 °C in an oven for 10 min. Prior to the immunoassay, PGE/MWNT electrodes were first preconditioned from −0.9 to +0.9 V at a scan rate of 100 mV s−1 (30 cycles) using cyclic voltammetry in PBS (pH 7.4). This process minimized the electrode-to-electrode variation and provided high precision and reproducibility among replicate experiments.
After the preconditioning of PGE/MWNT electrodes by potential cycling, about 10 μL of Py solution (10 mM in DMF) was added and adsorbed for 1 h to form strong π–π stacked MWNT/Py assemblies on the surface of PGE electrodes. A freshly prepared 10 μL solution of EDC (0.35 M) and NHS (0.1 M) was added to activate the carboxyl groups of Py for 15 min at room temperature. Then 10 μL of monoclonal Abinsulin (0.25 mg mL−1, acetate buffer, pH 5.0) was placed on PGE/MWNT/Py electrodes to initiate amine-carboxyl coupling by incubation at 4 °C for 45 min. This process enabled the covalent attachment of Abinsulin to the surface Py linkers. After a rinse in water to remove the free antibody solution, the surface of PGE/MWNT/Py-Abinsulin was blocked by 10 μL of 2% BSA in PBS, pH 7.4 for 30 min to minimize nonspecific binding.29,30
Finally, different concentrations of free serum insulin solutions were allowed to bind the surface antibody for 20 min at 4 °C to obtain insulin and antibody complexes on PGE/MWNT/Py-Abinsulin electrodes. Similarly, the standard serum insulin or patient serum insulin conjugates with MNP were prepared as described above and detected upon binding to the surface antibody. The voltammetric detection of antibody-bound serum insulin molecules was accomplished by monitoring the decreases in currents of a redox probe, potassium ferricyanide, and potassium ferrocyanide [Fe- (CN)63−/4−] mixture, in solution. The voltammetric sensor results presented are based on 3 replicate measurements with at least 3 electrodes for each concentration and control.
RESULTS AND DISCUSSION
FTIR and Microscopic Characterization of Immunosensor Surface
The attachment of Abinsulin onto the PGE/MWNT/Py electrodes was confirmed by FTIR spectroscopy and SEM analysis (Figures S1–S2 of the Supporting Information). As shown in Figure S1 A of the Supporting Information, MWNT drop-coated on the electrode displayed a weak —C=C stretching frequency at 1558 cm−1. The two strong peaks at 1671 and 3298 cm−1 suggest the presence of —C=O and nonhydrogen bonded –OH functionalities, respectively. The functionalization of MWNT with Py showed the carboxylic acid —C=O stretching frequency at 1743 cm−1 and the –OH vibration at 3339 cm−1 (Figure S1 B of the Supporting Information). Antibody immobilization gave the characteristic intense amide-I band at 1741 cm−1, amide-II band at 1641 cm−1, and a medium amide-A NH-stretching peak at ~3373 cm−1 (Figure S1 C of the Supporting Information).31 The SEM image of bare PGE electrode showing the characteristic surface defects (Figure S2 A of the Supporting Information) were completely covered by the thin cylindrical tubelike textures of MWNT (Figure S2 B of the Supporting Information). Following the Abinsulin immobilization, a densely packed fibrous surface was observed (Figure S2 C of the Supporting Information).17
In addition to SEM characterization, the topographic imaging of the immunosensor surface was acquired by AFM in the tapping mode, and the surface roughness at every step of immunoassay was estimated similar to that reported before (Figure S3 of the Supporting Information).32 The PGE/MWNT electrode showed an average surface roughness (Rq) of 51 ± 2 nm (Figure S3 A of the Supporting Information). The antibody immobilization to the MWNT-stacked Py units increased the surface roughness to 64 ± 3 nm (Figure S3 B of the Supporting Information). Subsequent blocking of the surface with BSA and treatment with 0 pM (control) serum insulin-MNP sample increased the surface roughness to 75 ± 11 nm (Figure S3 C of the Supporting Information). In contrast, the binding of serum insulin-MNP conjugates (50 and 100 pM) led to significantly large surface roughness increases of 143 ± 7 nm (Figure S3 D of the Supporting Information) and 261 ± 11 nm (Figure S3 E of the Supporting Information), respectively. Thus, AFM imaging identified the surface features of the designed PGE/MWNT/Py-based voltammetric immunosensor.
Confocal Microscopy
Figure 2 represents the confocal images of 100 pM FITC-insulin prepared in human serum and then bound to MNP by the above-described amine-carboxylic acid chemistry involving EDC/NHS reagents. As a control sample, the human serum with no added FITC-insulin was reacted with MNP. Figure 2A shows the fluorescence emission from the MNP-bound FITC-tag of insulin from the serum sample. Qualitatively, the serum FITC-insulin conjugate of MNP exhibited noticeable fluorescence intensity, while the control human serum-MNP conjugate with no added FITC-insulin did not show any fluorescence signals (Figure 2B). This result confirms the feasibility of attaching insulin present in serum to MNP.
Figure 2.
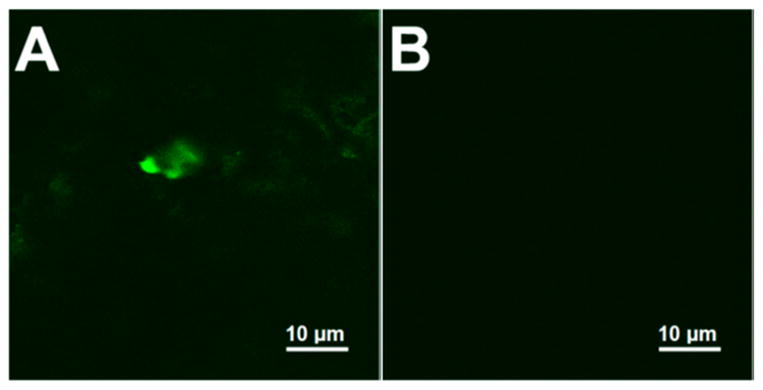
Confocal microscope images of (A) 100 pM serum FITC-tagged insulin-MNP conjugate and (B) only human serum-MNP control with no added FITC-tagged insulin.
Furthermore, as a positive control, FITC-tagged insulin (100 pM) was prepared in PBS and conjugated to MNP and confocal image of this buffer FITC-insulin-MNP conjugate was acquired. Figure S4 of the Supporting Information shows that the fluorescence intensity of FITC-tagged buffer insulin-MNP conjugate is greater than the corresponding serum FITC-insulin- MNP conjugate (Figure 2A), which can be expected for the MNP-bound FITC-insulin from a simple buffer medium that is free of serum proteins to compete for binding with MNP.
Particle Size Measurements by Dynamic Light Scattering (DLS)
The hydrodynamic sizes of serum insulinconjugated MNP samples were determined by dynamic light scattering by using PBS (pH 7.4) as the dispersant. As tabulated in Table S1 of the Supporting Information, the average hydrodynamic particle sizes of MNP increased with an increase in serum insulin concentration used for conjugation. Similarly, the buffer insulin-MNP conjugates showed an increase in the hydrodynamic diameter with increasing insulin concentration used for conjugation with MNP. Interestingly, the hydrodynamic sizes of serum insulin-MNP are about 2.5- to 3-fold larger than the corresponding buffer insulin-MNP conjugates, suggesting the extended clustering of MNP in a serum medium. The polydispersity indices with values >0.1 (N = 3 replicates) further confirmed the existence of different sizes of clustered MNP (Table S1 of the Supporting Information).
Quantitation of Serum or Buffer Insulin Molecules Bound to MNP
For estimating the number of serum insulin molecules bound to MNP, we used an enzyme-linked immunosorbent assay (ELISA, Mercodia, Sweden) and determined the difference in free serum insulin concentration before and after binding with MNP. From this procedure, we found that the number of serum insulin molecules bound to MNP was ~1.0 (±0.1) × 1010. The theoretical number of insulin molecules present in the prepared 100 pM insulin solution (250 μL) was 1.5 × 10¹⁰, which suggests ~66% binding efficiency of serum insulin with MNP under the conditions followed.
Similar to the serum insulin-MNP conjugation, we estimated the MNP-bound insulin in buffer (positive control) from the difference in absorbance of free buffer insulin before and after binding with MNP by the standard Bradford protein assay (Figure S5 of the Supporting Information). For the Bradford assay, we used a solution of 1 mM insulin concentration in buffer to obtain an easily measurable difference in absorbance signals. The number of buffer insulin molecules measured by the Bradford assay in the 1 mM insulin solution used was ~2.1 (±0.11) × 1015 and that remained in the buffer after attachment with MNP was ~0.9 (±0.1) × 1015, which suggests about 57% binding efficiency.
Indirect Detection of Free Insulin in Serum
Figure S6A of the Supporting Information shows the increase in direct insulin oxidation signals with concentration (at ~0.7 V vs Ag/AgCl) for the binding of standard buffer insulin solutions to the surface antibody on PGE/MWNT/Py-Abinsulin/BSA electrodes. The tyrosine residues of insulin have been shown to undergo oxidation at this potential.33 In contrast, the binding of picomolar insulin present in the serum to surface antibody did not show a notable oxidation current increase with concentration (Figure S7 of the Supporting Information). This suggests the poor sensitivity of surface antibody on PGE/MWNT/Py-Abinsulin/BSA electrodes for detecting insulin oxidation present in the complex serum matrix and a possible interference from the nonspecific binding of serum proteins to sensor surface. Hence, we devised an indirect voltammetric detection of serum insulin levels based on the current signal decrease of the soluble Fe(CN)63−/4− redox probe (1 mM each) in PBS electrolyte (10 mL), pH 7.4.
Figure 3 shows the decrease in redox currents of the Fe(CN)63−/4− probe for the binding of various concentrations of free serum insulin to the surface antibody on PGE/MWNT/Py-Abinsulin/BSA electrodes. This indirect insulin immunoassay provided a limit of detection (LOD) of 15 pM. The percentage relative current signal decrease was calculated by using the eq,
Figure 3.
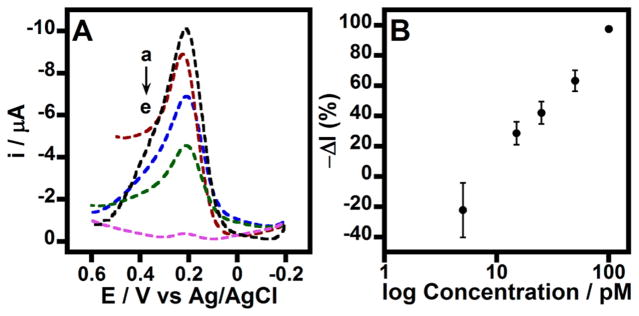
(A) Square wave voltammograms in 1 mM Fe(CN)63−/4−, PBS for modified PGE/MWNT/Py-Abinsulin/BSA electrodes treated with (a) 0 (control), (b) 15, (c) 25, (d) 50, and (e) 100 pM concentrations of free insulin spiked in serum. Amplitude: 15 mV and frequency: 10 Hz. (B) Corresponding immunosensor signal changes for various concentrations of serum insulin.
where Io is the average current for zero control (with no added insulin) and Ic is the average current for various concentrations of serum insulin.
Sensitivity Enhancement of Serum Insulin Detection via Binding to MNP
The above presented results suggest that the large, conductive surface area from the MWNT/Py modification on PGE electrodes for anti-insulin antibody immobilization enabled the detection of picomolar serum insulin levels directly. Our prior report on detecting serum insulin by an electrochemical mass sensor (quartz crystal microbalance coupled with electrochemical impedance) demonstrated that the conjugation of serum insulin to magnetic nanoparticles could significantly minimize nonspecific signals and thus amplify the sensitivity of detecting clinically relevant picomolar serum insulin.29 Similarly, in the present work, with the goal to enhance/obtain better sensitivity of serum insulin detection in the designed voltammetric immunosensor platform, we employed the conjugation of serum insulin with volume efficient, large surface area MNP (details under Experimental).29,34 Similar to the free serum insulin detection discussed above, we used the soluble Fe(CN)63−/4− redox probe to monitor the current signals decrease with the binding of increasing serum insulin concentration-MNP conjugates to surface antibody on MWNT/Py modified electrodes.
The serum insulin concentration-dependent decreases in currents (Figure 4A) were observed for the binding of serum insulin-MNP conjugates to surface antibody by square wave voltammetry. From this, we determined that the MNP-conjugation of serum insulin allowed a 3-fold lower detection limit of 5 pM than the free serum insulin detection. As a positive control, we prepared buffer insulin-MNP conjugates and tested the sensor responses with increasing buffer insulin concentrations. Figure S8 of the Supporting Information shows that similar to the serum insulin-MNP, we noted a decrease in currents of the redox probe with an increase in buffer insulin concentrations used in the insulin-MNP conjugation. Interestingly, the sensitivity for detecting serum insulin-MNP is better than the detection of buffer insulin-MNP (Figure 4B and Figure S8 B of the Supporting Information), which could be attributed to the observed greater clustering of MNP in the serum insulin-MNP conjugate (Table S1 of the Supporting Information) with minimized nonspecific zero control currents than the buffer insulin-MNP (Figure 4A vs Figure S8 A of the Supporting Information). Moreover, the MNP conjugation of serum insulin allowed a better dynamic range than the direct detection of free serum insulin (current signal decreased to a minimum even at 100 pM free serum insulin concentration, Figure 3A).
Figure 4.

(A) Square wave voltammograms of modified PGE/MWNT/Py-Abinsulin/BSA electrodes treated with (a) 0 (control), (b) 5, (c) 25, (d) 50, (e) 100, and (f) 200 pM concentrations of insulin-MNP samples prepared from serum. Voltammograms were acquired in 1 mM Fe(CN)63−/4−, PBS, amplitude: 15 mV; frequency: 10 Hz. (B) Corresponding logarithmic calibration plot. Where, T1D and T2D are type 1 and type 2 diabetes patient serum samples detected under similar conditions via the MNP conjugation (details below).
Cyclic Voltammetry (CV) to Obtain Additional Mechanistic Details
The decrease in redox currents and increase in CV peak separation (ΔEp) with the binding of different concentrations of serum insulin-MNP conjugates to surface antibody on PGE/MWNT/Py-Abinsulin/BSA electrodes are shown in Figure S9 of the Supporting Information. The increase in ΔEp suggests the decreasing electron transfer kinetics of the Fe(CN)63−/4− redox probe to communicate with the electrode (Figure S10 of the Supporting Information). Thus, the observed decreases in currents and large peak separation suggest the existence of diminished electroactive sensor sites and large kinetic barrier between the redox probe and electrode in proportion to the formation of antibody– antigen complex between the surface antibody and free serum insulin or insulin bound-MNP conjugates. Thus, CV measurements complemented the square wave voltammetric sensing and offered additional kinetic information about the sensor function.
Comparative Mass Quantification with and without MWNT/Py Assembly
The mass change on the sensor surface at each step of the immunoassay was investigated by QCM. For this, gold-coated quartz crystals (10 MHz oscillation frequency) were immersed in mixed monoalkanethiols-poly(ethylene glycol) solution [90% HS–(PEG)3–OH and 10% HS– (PEG)6–COOH in ethanol (denoted as PEG in Table 1)] overnight to allow the formation of mixed self-assembled monolayers (SAMs).35 Following this, MWNT/Py modification, antibody attachment, BSA blocking step, and subsequent binding of serum insulin-MNP conjugates were performed similar to the procedure of the voltammetric immunosensor on PGE electrodes. The crystals were rinsed in water between each assay step, and the frequency decrease was measured in PBS, pH 7.4. To determine the effect of MWNT/Py modification, similar immunoassay mass measurements were done using only the self-assembled monolayer coated Au crystals (i.e., with no MWNT/Py surface).
Table 1.
Quantitative Estimation of Immunosensors with and without MWNT/Py Assembly (Mean ± Standard Deviation for N = 3 Replicates)
| sensor surface | frequency decrease (Hz) | mass coated (μg cm−2) |
|---|---|---|
| (A) no MWNT/Py assembly | ||
| Au-PEG (initial) | ||
| Au-PEG-Abinsulin | 426 ± 25 | 0.38 ± 0.07 |
| Au-PEG-Abinsulin/BSA | 152 ± 54 | 0.14 ± 0.05 |
| Au-PEG-Abinsulin/BSA/200 pM serum insulin-MNP sample (subtracted for control serum-MNP response) | 369 ± 38 | 0.33 ± 0.04 |
| (B) with MWNT/Py assembly | ||
| Au-PEG/MWNT/Py (initial) | ||
| Au-PEG/MWNT/Py-Abinsulin | 1299 ± 144 | 1.17 ± 0.27 |
| Au-PEG/MWNT/Py-Abinsulin/BSA | 272 ± 66 | 0.25 ± 0.05 |
| Au-PEG/MWNT/Py-Abinsulin/BSA/200 pM serum insulin-MNP sample (subtracted for control serum-MNP response) | 736 ± 11 | 0.66 ± 0.01 |
Using the Sauerbrey equation,
we estimated the mass coated on the quartz crystal, where Δf is the frequency change from the mass adsorbed, fo is the fundamental frequency of oscillation (10 MHz), A is the geometric area of the gold disc bonded to the quartz crystal (0.2 cm2), μ is the shear modulus of quartz crystal (2.947 × 10¹¹ dyn cm−2), and ρ is the density of quartz crystal (2.648 g cm−3).29,36 Table 1 provides the quantitative estimation of immunoassay components for the binding of serum insulin- MNP onto the surface antibody of Au-PEG-Abinsulin/BSA and Au-PEG/MWNT/Py-Abinsulin/BSA quartz crystals.
Role of MWNT/Py Modification in the Sensitive Detection of Serum insulin
As illustrated in Table 1, the MWNT/Py framework captured about 3-times more antibody molecules in comparison to the gold surface without the MWNT/Py modification. This in turn yielded approximately a 2-fold enhancement in the frequency decrease in QCM for the binding of serum insulin-MNP to the surface antibody of Au-PEG/MWNT/Py-Abinsulin assembly on quartz crystals. This result indicates that about one-third of antibody sites are not available for insulin binding (Table 1). The one-third of inaccessible Abinsulin sites can be ascribed to unfavorable Abinsulin orientations for insulin binding and/or to clustered MNP29 around insulin-bound antibody that can sterically inhibit the binding of other insulin-MNP molecules to neighboring antibody sites. Overall, the QCM study supports the function of voltammetric immunosensor and infers that MWNT/Py modification has the advantage of offering enhanced sensitivity for serum insulin detection.
Correlation of voltammetric sensor results with ELISA
The voltammetric sensor responses for various serum insulin concentrations were compared with the estimation of serum insulin by a standard ELISA kit (Mercodia, Sweden). Figure 5 shows good correlation between serum insulin concentrations measured by the designed voltammetric sensor and ELISA methods. It is important to note that the commercial ELISA requires a secondary antibody labeled with horseradish peroxidase and its reaction with a substrate to measure serum insulin concentration. In contrast, the presented voltammetric immunosensor does not have such requirements other than an inexpensive redox probe.
Figure 5.

Correlation of the designed voltammetric immunosensor with standard ELISA for detection of human serum insulin levels.
Detection of Insulin in Diabetic Patient Serum Samples
The ultimate objective of the presented novel serum insulin voltammetric immunosensor is to employ it for the diagnosis of type 1 and type 2 diabetic conditions in patients. We therefore examined insulin concentrations in type 1 and type 2 diabetic patient serum samples purchased from BioreclamationIVT (Westbury, NY). The patient serum insulin-MNP samples were prepared similar to the standard serum insulin-MNP as detailed in Experimental Section. Since, our voltammetric sensor directly detects diagnostically useful picomolar insulin concentrations, the conjugation of patient serum samples with MNP was straightforward and did not necessitate any additional dilution procedures. The patient serum insulin concentrations were determined using the calibration plot of standard serum insulin-MNP signals as shown in Figure 4B. Additionally, a good correlation was noted with ELISA results as shown in Figure 6, which thus validates the applicability of the demonstrated PGE/MWNT/Py-Abinsulin voltammetric insulin immunosensor for clinical use.
Figure 6.

Correlation plot of voltammetric immunosensor with standard ELISA for (1) type 1 and (2) type 2 diabetes patient serum samples.
CONCLUSIONS
The results presented above demonstrate for the first time that a conductive MWNT/Py framework on electrodes can offer a highly sensitive voltammetric platform for the detection of patient serum insulin levels to diagnose and distinguish type 1 and type 2 diabetic disorders by an immunoassay. The designed immunosensor involves a simple and robust electrode modification and offers high sensitivity and reproducibility. With consideration of the rapid growth of both type 1 and type 2 disorders worldwide and associated lethal complications, a simple and accurate insulin assay is quite useful. Thus, the presented voltammetric insulin immunosensor has the potential to be clinically useful for diagnosis of diabetes type in serum samples.
Supplementary Material
Acknowledgments
Research reported in this publication was supported by the National Institute of Diabetes and Digestive and Kidney Diseases of the National Institutes of Health under Award Number R15DK103386. The content is solely the responsibility of the authors and does not necessarily represent the official views of the National Institutes of Health.
Footnotes
The authors declare no competing financial interest.
Figures S1–S10: FTIR, SEM and AFM characterization, confocal images of buffer insulin-MNP and only MNP in buffer, Bradford assay absorbance spectra for buffer insulin, immunosensor signals for direct buffer and serum insulin oxidation currents, voltammograms of buffer insulin-MNP as a positive control, and CVs and peak separation versus concentration of serum insulin-MNP. Table S1: particle size measurements. This material is available free of charge via the Internet at http://pubs.acs.org.
References
- 1.Selvin E, Parrinello CM, Sacks DB, Coresh J. Ann Intern Med. 2014;160:517–525. doi: 10.7326/M13-2411. [DOI] [PMC free article] [PubMed] [Google Scholar]
- 2.Mizutani F, Ohata E, Mie Y, Niwa O, Yasukawa T. Sens Actuators B. 2008;135:304–308. [Google Scholar]
- 3.Melloul D, Marshak S, Cerasi E. Diabetologia. 2002;45:309–326. doi: 10.1007/s00125-001-0728-y. [DOI] [PubMed] [Google Scholar]
- 4.Tannuri U, Coelho MC, Maksoud JG. Pediatric Surgery International. 1993;8:210–214. [Google Scholar]
- 5.Cheng KW. J Clin Endocrinol Metab. 1975;41:581–589. doi: 10.1210/jcem-41-3-581. [DOI] [PubMed] [Google Scholar]
- 6.Andersen L, Dinesen B, Jorgensen PN, Poulsen F, Roder ME. Clin Chem. 1993;39:578–582. [PubMed] [Google Scholar]
- 7.Manley SE, Stratton IM, Clark PM, Luzio SD. Clin Chem. 2007;53:922–932. doi: 10.1373/clinchem.2006.077784. [DOI] [PubMed] [Google Scholar]
- 8.Okuno J, Maehashi K, Kerman K, Takamura Y, Matsumoto K, Tamiya E. Biosens Bioelectron. 2007;22:2377–2381. doi: 10.1016/j.bios.2006.09.038. [DOI] [PubMed] [Google Scholar]
- 9.Strack G, Nichols R, Atanassov P, Luckarift HR, Johnson GR. Methods Mol Biol. 2013;1051:217–228. doi: 10.1007/978-1-62703-550-7_14. [DOI] [PubMed] [Google Scholar]
- 10.Chen RJ, Zhang Y, Wang D, Dai H. J Am Chem Soc. 2001;123:3838–3839. doi: 10.1021/ja010172b. [DOI] [PubMed] [Google Scholar]
- 11.Halámková L, Halámek J, Bocharova V, Szczupak A, Alfonta L, Katz E. J Am Chem Soc. 2012;134:5040–5043. doi: 10.1021/ja211714w. [DOI] [PubMed] [Google Scholar]
- 12.Schubert K, Goebel G, Lisdat F. Electrochim Acta. 2009;54:3033–3038. [Google Scholar]
- 13.Giroud F, Minteer SD. Electrochem Commun. 2013;34:157–160. [Google Scholar]
- 14.Lalaoui N, Elouarzaki K, Le Goff A, Holzinger M, Cosnier S. Chem Commun. 2013;49:9281–9283. doi: 10.1039/c3cc44994g. [DOI] [PubMed] [Google Scholar]
- 15.Jönsson-Niedziolka M, Kaminska A, Opallo M. Electrochim Acta. 2010;55:8744–8750. [Google Scholar]
- 16.Krishnan S, Armstrong FA. Chem Sci. 2012;3:1015–1023. [Google Scholar]
- 17.Walgama C, Krishnan S. J Electrochem Soc. 2014;161:H47–H52. [Google Scholar]
- 18.Freckmann G, Hagenlocher S, Baumstark A, Jendrike N, Gillen RC, Rössner K, Haug C. J Diabetes Sci Technol. 2007;1:695–703. doi: 10.1177/193229680700100513. [DOI] [PMC free article] [PubMed] [Google Scholar]
- 19.Muoio DM, Newgard CB. Nat Rev Mol Cell Biol. 2008;9:193–205. doi: 10.1038/nrm2327. [DOI] [PubMed] [Google Scholar]
- 20.Weyer C, Hanson RL, Tataranni PA, Bogardus C, Pratley RE. Diabetes. 2000;49:2094–2101. doi: 10.2337/diabetes.49.12.2094. [DOI] [PubMed] [Google Scholar]
- 21.Goetz FC, French LR, Thomas W, Gingerich RL, Clements JP. Metabolism. 1995;44:1371–1376. doi: 10.1016/0026-0495(95)90045-4. [DOI] [PubMed] [Google Scholar]
- 22.Wang J, Musameh M. Anal Chim Acta. 2004;511:33–36. [Google Scholar]
- 23.Rafiee B, Fakhari AR. Biosens Bioelectron. 2013;46:130–135. doi: 10.1016/j.bios.2013.01.037. [DOI] [PubMed] [Google Scholar]
- 24.Arvinte A, Westermann AC, Sesay AM, Virtanen V. Sens Actuators B. 2010;150:756–763. [Google Scholar]
- 25.Wang J, Tangkuaram T, Loyprasert S, Vazquez-Alvarez T, Veerasai W, Kanatharana P, Thavarungkul P. Anal Chim Acta. 2007;581:1–6. doi: 10.1016/j.aca.2006.07.084. [DOI] [PubMed] [Google Scholar]
- 26.Pu Y, Zhu Z, Han D, Liu H, Liu J, Liao J, Zhang K, Tan W. Analyst. 2011;136:4138–4140. doi: 10.1039/c1an15407a. [DOI] [PMC free article] [PubMed] [Google Scholar]
- 27.Prasad BB, Madhuri R, Tiwari MP, Sharma PS. Electrochim Acta. 2010;55:9146–9156. [Google Scholar]
- 28.Serafin V, Agüí L, Yáñez-Sedeño P, Pingarrón JM. Biosens Bioelectron. 2014;52:98–104. doi: 10.1016/j.bios.2013.08.021. [DOI] [PubMed] [Google Scholar]
- 29.Singh V, Krishnan S. Analyst. 2014;139:724–728. doi: 10.1039/c3an01542d. [DOI] [PubMed] [Google Scholar]
- 30.Krishnan S, Mani V, Wasalathanthri D, Kumar CV, Rusling JF. Angew Chem, Int Ed. 2011;50:1175–1178. doi: 10.1002/anie.201005607. [DOI] [PMC free article] [PubMed] [Google Scholar]
- 31.Kong J, Yu S. Acta Biochim Biophys Sin. 2007;39:549–559. doi: 10.1111/j.1745-7270.2007.00320.x. [DOI] [PubMed] [Google Scholar]
- 32.Malhotra R, Papadimitrakopoulos F, Rusling JF. Langmuir. 2010;26:15050–15056. doi: 10.1021/la102306z. [DOI] [PMC free article] [PubMed] [Google Scholar]
- 33.Zhang M, Mullens C, Gorski W. Anal Chem. 2005;77:6396–6401. doi: 10.1021/ac0508752. [DOI] [PubMed] [Google Scholar]
- 34.Krishnan S, Walgama C. Anal Chem. 2013;85:11420–11426. doi: 10.1021/ac402421z. [DOI] [PubMed] [Google Scholar]
- 35.Sigel GB, Bamdad C, Barberis A, Stromlinger J, Whitesides GM. Anal Chem. 1996;68:490–497. doi: 10.1021/ac9504023. [DOI] [PubMed] [Google Scholar]
- 36.Alfonta L, Willner I. Anal Chem. 2001;73:5287–5295. doi: 10.1021/ac010542e. [DOI] [PubMed] [Google Scholar]
Associated Data
This section collects any data citations, data availability statements, or supplementary materials included in this article.