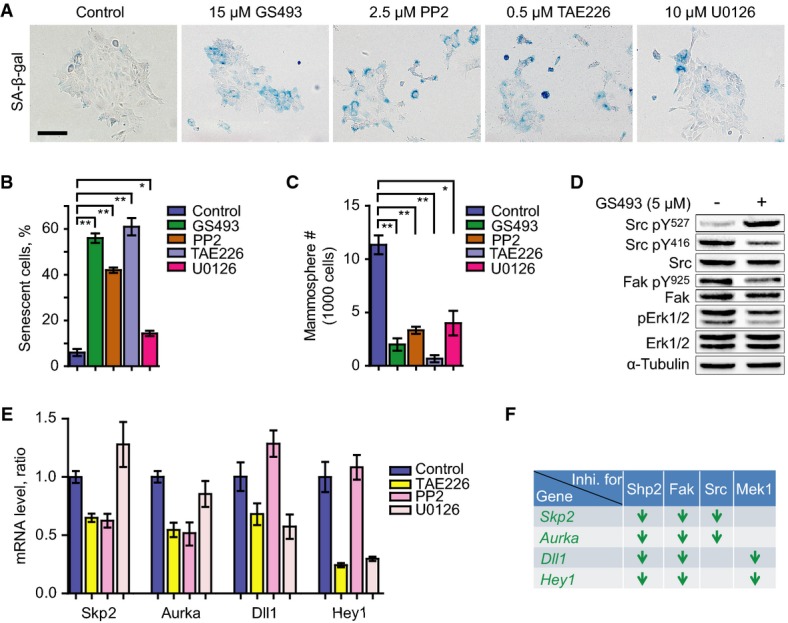
SA-β-gal staining on PyMT tumor cells treated with control, Shp2 inhibitor GS493 (15 μM), Src inhibitor PP2 (2.5 μM), Fak inhibitor TAE226 (0.5 μM), or Mek1 inhibitor U0126 (20 μM). Scale bar, 100 μm.
Quantification of the numbers of senescent cells in the presence or absence of the inhibitors, as shown in (A). Error bars represent SEM (n = 3). *P < 0.05; **P < 0.01.
Quantification of the numbers of spheres in the presence or absence of the inhibitors, as in (A). Error bars represent SEM (n = 3). *P < 0.05; **P < 0.01.
Western blot analysis of pY527, pY416 and total Src, pY925 and total Fak, pT202/pT204 and total Erk1/2, and α-tubulin in PyMT tumor cells with or without treatment with 5 μM GS493.
qRT–PCR analysis of mRNA levels of Skp2, Aurka, Dll1, and Hey1 in control cells and those treated with the indicated inhibitors. Error bars represent SEM (n = 3).
Summary of the deregulated genes by the chemical inhibition of Shp2, Src, Fak, and Mek1 signaling. Arrows represent downregulation of genes. Statistical significance was assessed by Student's unpaired t-test.
Source data are available online for this figure.

