Figure 1.

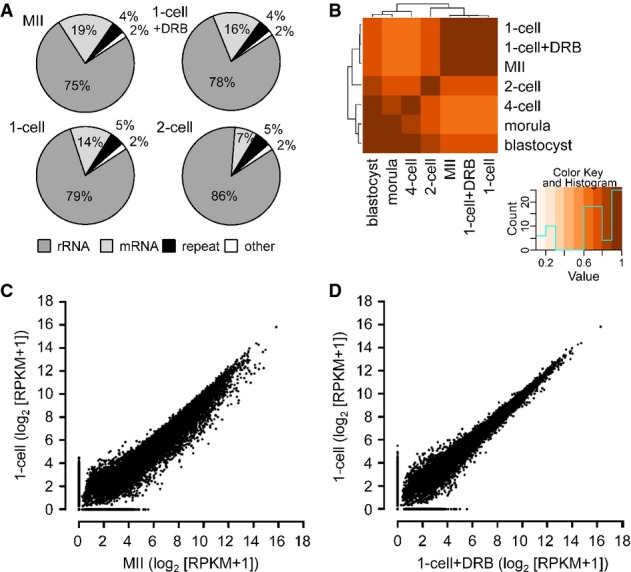
- A Composition of selected libraries produced from total RNA. Shown is the proportion of reads matching rRNA-derived transcripts (rRNA), transcripts produced from repeats identified by RepeatMasker (repeat), annotated mRNAs (mRNA), and other sequences (other).
- B Hierarchical clustering of 76-nt paired-end datasets from different stages of preimplantation development performed on Spearman correlations between log2 of RPKM values for transcripts.
- C, D Comparison of MII and 1-cell transcriptomes (C) and 1-cell and 1-cell + DRB transcriptomes (D). The graph was made by plotting expression values for mRNAs (log2[RPKM + 1]) from 76PE sequencing data. Each point represents one transcript whose position indicates its abundance value in indicated stages. RPKM values were increased by adding 1 in order to obtain log2 values above zero.
