Figure 2.

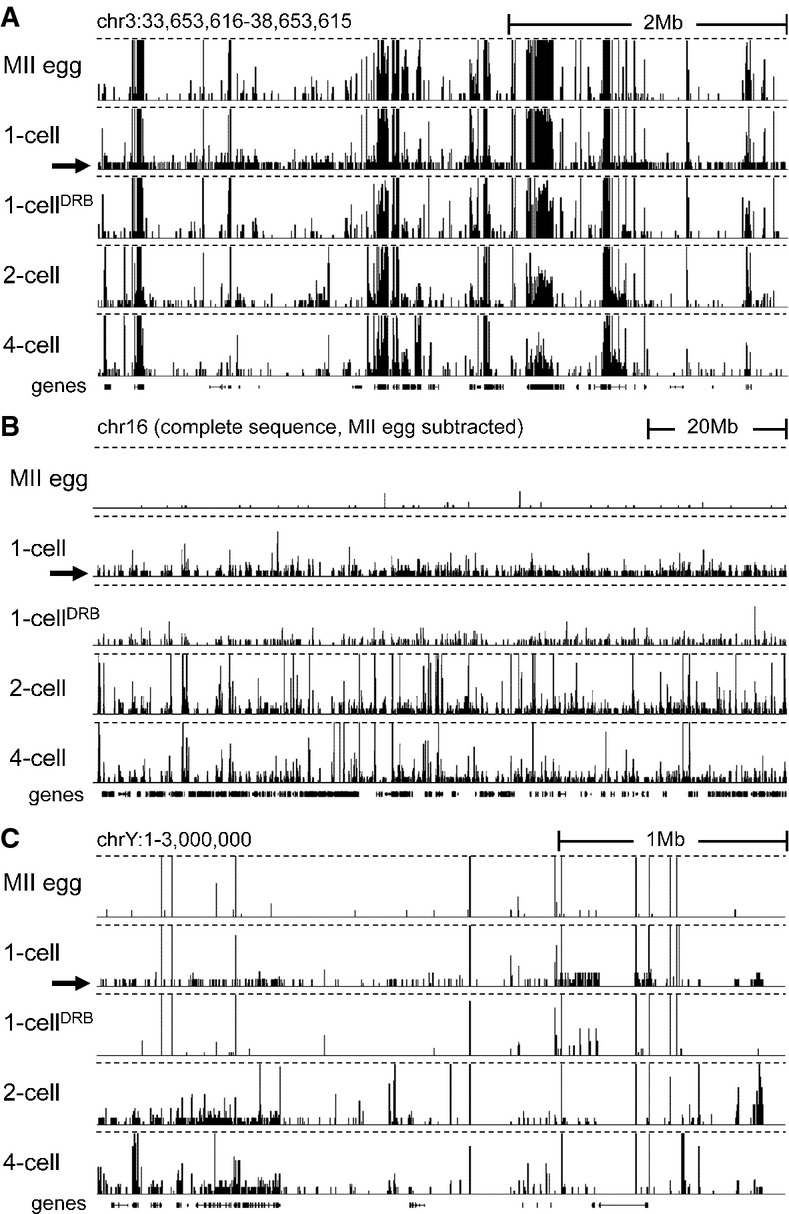
- Transcription at the 1-cell stage manifests as increased number of low CPM reads scattered across the genome. Shown are HTS data [a customized screenshot from the UCSC Genome browser (Karolchik et al, 2012)] from different stages mapped into a 5-Mb region of the genome with a variable gene density. The vertical scale was trimmed at 0.5 CPM; trimming is indicated by horizontal dashed lines. Note the appearance of low-density reads in 1-cell embryos (indicated by the black arrow), which are not observed in unfertilized oocytes and 1-cell embryos treated with DRB. Low CPM reads also appear in intergenic regions.
- Masking maternally transcribed regions reveals chromosome-wide presence of low CPM reads in 1-cell embryos. A UCSC browser screenshot of the chromosome 16 shows 76PE raw data mapped to the genome upon masking reads derived from oocytes. The vertical scale was trimmed at 20 reads; trimming is indicated by horizontal dashed lines. A small number of reads detected in MII eggs comes from repetitive sequences, which otherwise do not yield signal because of multi-mapping restrictions.
- Zygotic transcription from the Y chromosome initiates at the 1-cell stage. Shown are HTS data from different stages mapped into the ˜3-Mb annotated region of the chromosome Y. The vertical scale was trimmed at 0.5 CPM; trimming is indicated by horizontal dashed lines. The residual signal on the chromosome Y in MII eggs and 1-cell embryos treated with DRB is an artifact caused by common retrotransposon-derived sequences (mainly MT-derived).
