Figure 3.

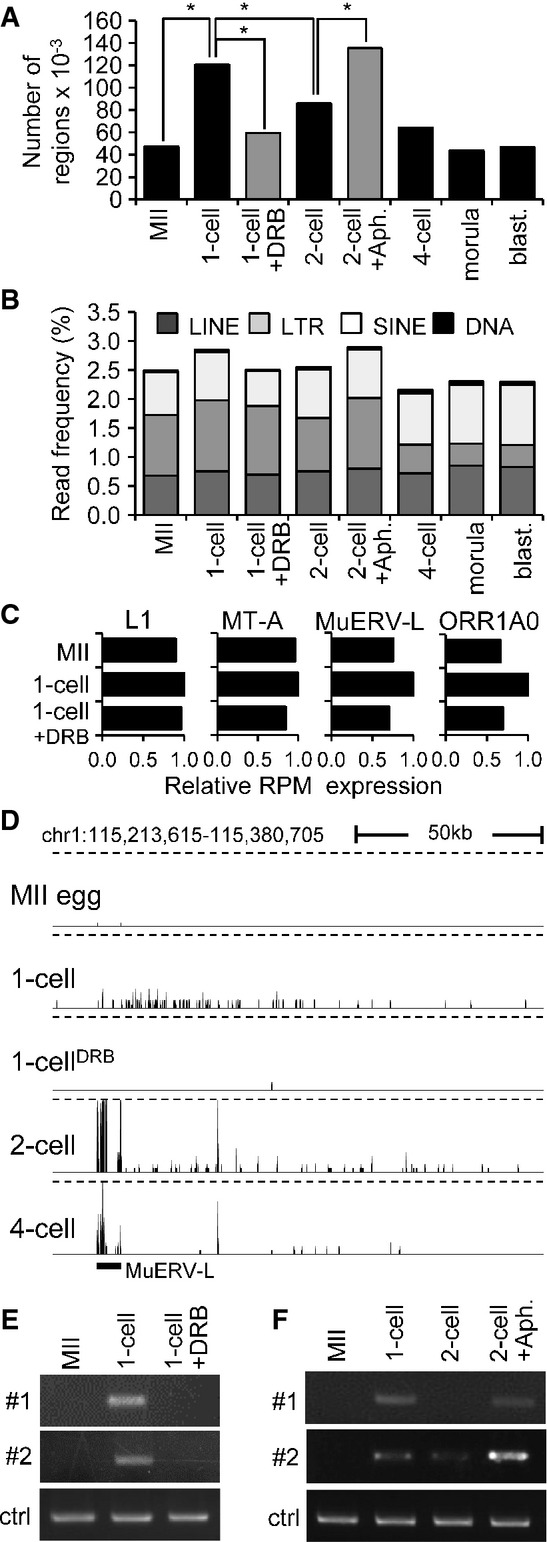
- A Quantitative analysis of transcription from intergenic regions in oocytes and preimplantation embryos. Intergenic regions were divided into 1-kb segments across the whole genome, and the number of segments to which at least a single read was uniquely mapped was determined. Results suggest that treatment of 1-cell embryos with DRB reduced the number of segments yielding intergenic transcripts. In contrast, treatment of 2-cell embryos with aphidicolin (Aph.) prevented reduction of the number of segments yielding intergenic transcripts. Bars representing samples treated with DRB and aphidicolin are gray to distinguish results from treated embryos and from the normal course of preimplantation development. An asterisk indicates a significant difference by chi-square test (P < 0.05).
- B Frequency of reads derived from mobile elements. Association of reads with a particular class of mobile DNA in each sample was determined by RepeatMasker and is displayed as a percentage of those reads in each library.
- C Relative changes of expression of four specific retrotransposons. Relative expression for each retrotransposon was calculated from RPKMs where expression in 1-cell embryos was set to one.
- D MuERV-L retrotransposons asymmetrically neighbor higher frequency of low CPM reads in large intergenic regions. Shown is an example of MuERV-L located in an intergenic region, which is not maternally expressed and becomes highly transcribed during zygotic genome activation at the 2-cell stage. A part of its transcription apparently invades almost 150 kb of its genomic flank, whereas the same region downstream of the MuERV-L yields higher frequency of low CPM reads in 1-cell stage in DRB-dependent manner. This pattern is most apparent for MuERV (see also Supplementary Fig S4B), but MT2 and ORR1AO insertions can also produce a similar asymmetric pattern (data not shown). The vertical scale was trimmed at 0.5 CPM; trimming is indicated by horizontal dashed lines.
- E, F Validation of intergenic transcription at the 1-cell stage. Two intergenic regions harboring low CPM reads on chromosome 2 in 1-cell embryos were analyzed by RT–PCR. Both loci are annotated in Supplementary Fig S4C. Shown in (E) is RT–PCR analysis of intergenic transcription of two loci (shown in detail in Supplementary Fig S4C) in MII eggs and 1-cell embryos treated with and without DRB. ctrl = RT–PCR of a spiked α-rabbit globin mRNA demonstrating consistent RT–PCR efficiency across samples. Shown in (F) is the effect of inhibiting the second round of DNA replication in intergenic transcription at the 2-cell stage as examined by RT–PCR. Two-cell embryos were treated with aphidicolin (Aph.) 15 h after insemination to inhibit the second round of DNA replication. ctrl = RT–PCR of a spiked rabbit α-globin mRNA demonstrating consistent RT–PCR efficiency across samples. Experiments were performed three times with reproducible results; a representative result is shown (E, F).
