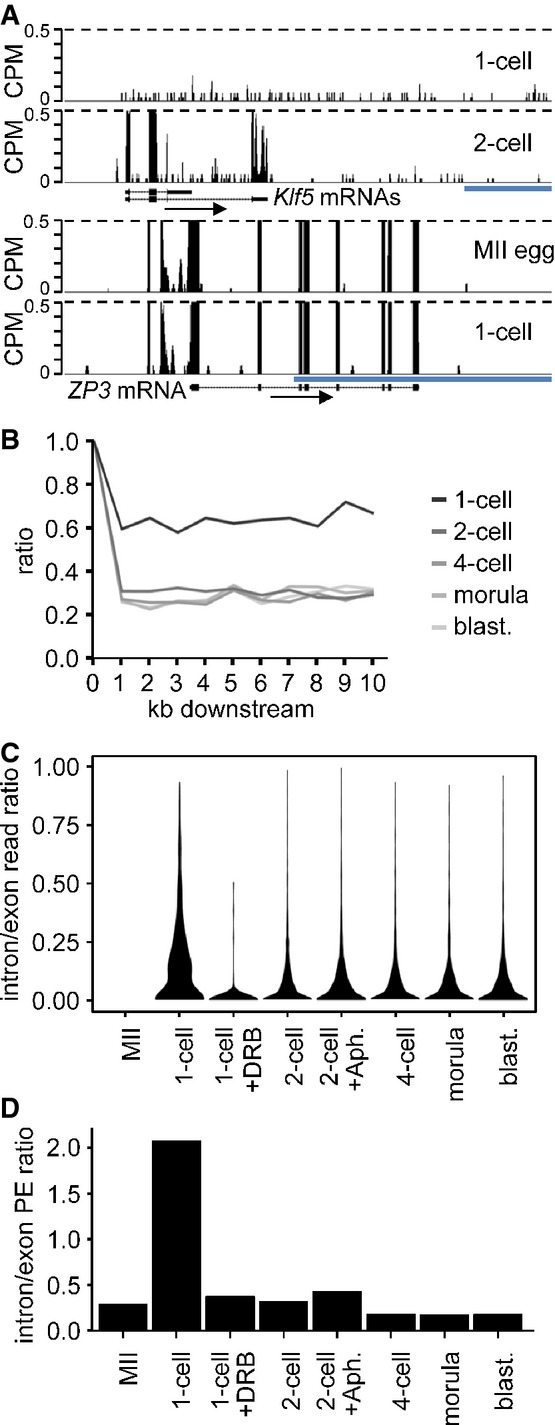
Example of a gene transcribed at 1-cell stage. Shown are reads from 1-cell- and 2-cell-derived paired-end-sequenced libraries mapping to the Klf5 gene region. Their distribution indicates inefficient splicing and 3′ end processing in 1-cell embryos. In contrast to the 2-cell embryo, the 1-cell embryo does not show any enrichment of exon-derived reads (exons are depicted as black rectangles) and no apparent transcriptional termination at the 3′ end. A detailed analysis of all reads mapping to the Klf5 gene identified a single read derived from a spliced Klf5 transcript. Below is shown profile of Zp3, an abundantly expressed oocyte-specific gene with very well defined exon–intron boundaries, which are retained also at the 1-cell stage. The vertical scale was trimmed at 0.5 CPM; trimming is indicated by horizontal dashed lines. The blue scale bars represent 10 kb.
Transcription termination analysis. Lines represent median ratios of read counts per kb (RPK) of reads downstream of transcription termination site to exons for gene sets transcribed in 1-cell embryos and subsequent stages but not in MII eggs. Downstream regions for genes with at least one RPK in exons are divided into 1-kb slices, and reads in each slice are counted and divided by the RPK value of the respective exon (point 1, 100%). The 1-cell stage shows higher downstream to exon read ratio indicating the extension of transcription past the polyA site.
Violin plot distributions of intron/exon read count ratios per cell stage for genes not transcribed in MII eggs. Intron and exon read counts were normalized to 1 kb length (RPK) and divided to obtain the read ratio for each region transcribed at the 1-cell stage or later. The 1-cell stage shows a shift toward higher intron/exon ratios indicating that a larger proportion of transcripts contain unspliced intronic regions, compared to the later stages. The MII stage is displayed as control and contains no values.
Comparison of unspliced/spliced read pair ratios per cell stage. Read counts where one end maps to intron/exon junction or entirely in intron and the other end maps to the adjacent exon were labeled as ‘unspliced’. The ‘spliced’ pairs were selected so that the one end maps either to the splice site and covers two adjacent exons or with each end mapping to separate, adjacent exons. The ratios of unspliced/spliced pair counts normalized to 1-kb length were calculated for all transcribed regions in 1,786 transcripts not expressed at MII and expressed at later stages. The 1-cell stage shows a clear dominance of unspliced reads over the spliced ones, indicating the increased incidence of intron retention in sequenced transcripts.

