Figure 7.

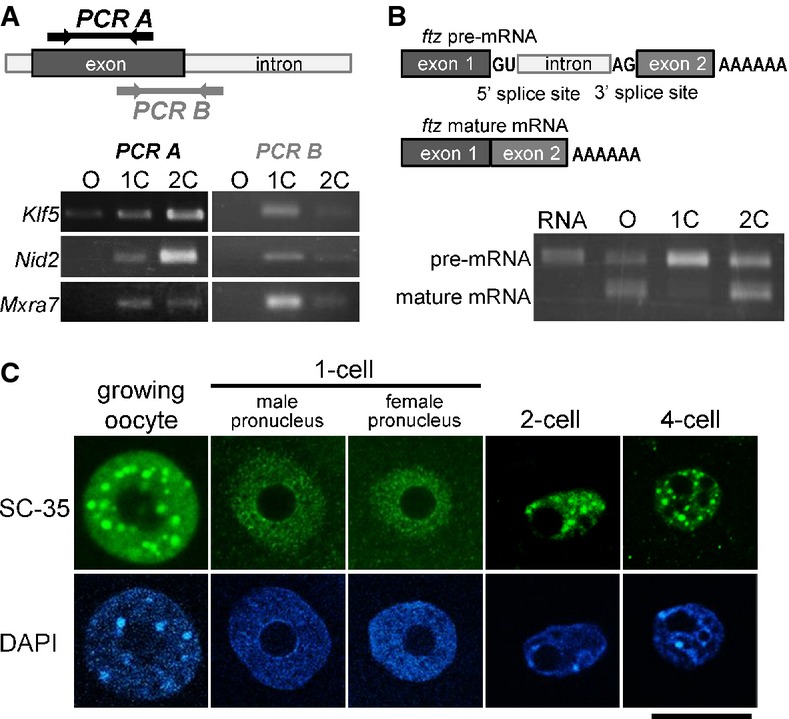
- RT–PCR analysis of unspliced introns. Upper portion shows the locations for which primer pairs were designed. Lower portion depicts results of an RT–PCR analysis using the primer pairs described in the upper diagram.
- Upper diagrams show the structures of pre- and mature ftz mRNAs. Synthesized ftz pre-mRNA was microinjected into growing oocytes, and 1- and 2-cell-stage embryos. Lower portion shows the results of RT–PCR using primer pairs for exons 1 (forward) and 2 (reverse).
- Immunofluorescence with an anti-SC-35 antibody of the nuclei of growing oocytes, and 1-, 2-, and 4-cell-stage embryos. The position of the nucleus, detected with DAPI, is shown in the lower portion of the figure. Scale bar, 20 μm.
