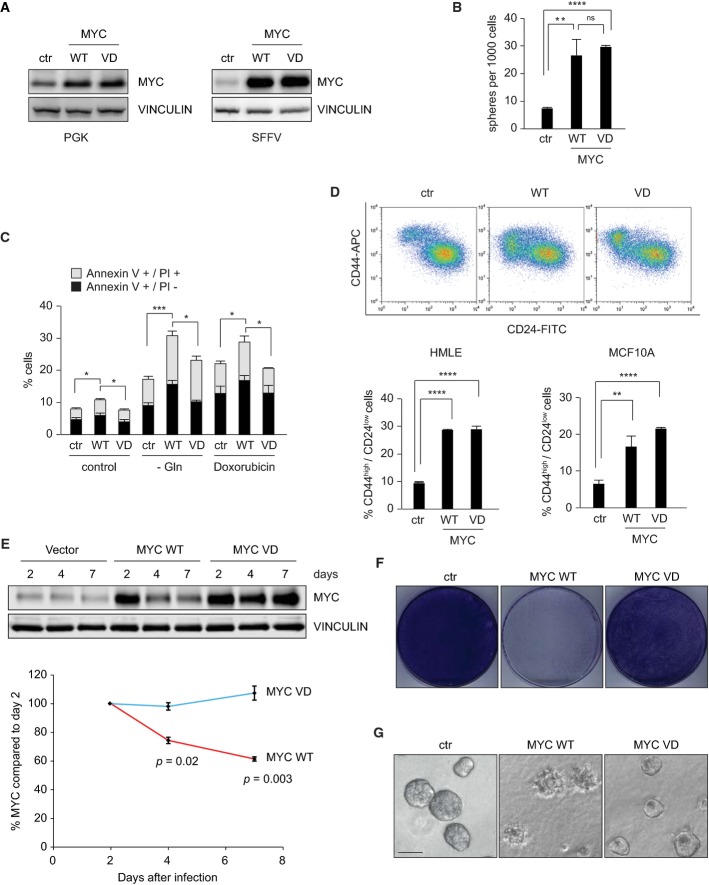
Immunoblot analysis documenting different Myc expression levels. The left panel shows levels of Myc in pools of cells infected with a virus that carries a PGK promoter (moderate levels); the right panel shows expression levels when Myc is expressed under the control of the SFFV promoter (high levels). Vinculin was used as a loading control (n = 3; unless otherwise indicated, n indicates the number of biological repeat experiments in the following legends).
Myc and MycVD promote mammosphere formation. The indicated pools of MCF10A cells were grown under non-adherent conditions. The graph shows the number of secondary mammospheres formed per 1,000 plated cells. P-values were calculated using a Student's t-test (n = 3, ns: P > 0.05; **P ≤ 0.01; ****P ≤ 0.0001).
Myc sensitizes MCF10A cells to apoptosis in a Miz1-dependent manner. The indicated pools of MCF10A cells expressing moderate Myc levels were grown under control or glutamine-deprived (−Gln) conditions for 24 h. Where indicated, doxorubicin was added (0.1 μg/ml; 24 h). The graph shows the percentage of early apoptotic (annexinV+/PI−) and late apoptotic (annexinV+/PI+; PI: propidium iodide) cells. Error bars show standard deviation (n = 3). P-values were calculated using a Student's t-test (*P ≤ 0.05; ***P ≤ 0.001).
High levels of Myc and MycVD induce a CD44high/CD24low surface phenotype in mammary epithelial cells. Pools of infected cells were analyzed by FACS. The upper panels show a representative experiment in HMLE cells. The lower panels show the quantification of CD44high/CD24low cells in HMLE and MCF10A cells. Error bars show standard deviation (n = 3). P-values were calculated using a Student's t-test (**P ≤ 0.01; ****P ≤ 0.0001).
High expression levels of Myc WT are counterselected more rapidly than MycVD in MCF10A cells. Upper panel: Cells were infected with the indicated vectors and harvested for immunoblots at the indicated time points. Vinculin was used as a loading control. A representative result is shown. Lower panel: Quantification of relative MYC levels from three independent biological experiments. P-values were calculated using a Student's t-test.
Colony assays documenting growth of pools of MCF10A cells infected with the indicated SFFV promoter-based expression viruses. A representative result of crystal violet stainings is shown (n = 3).
Photographs documenting growth of pools of MCF10A cells infected with the indicated SFFV promoter-based expression viruses in three-dimensional culture. Pictures were taken at day 4 of acinar culture. Scale bar, 50 μm.

