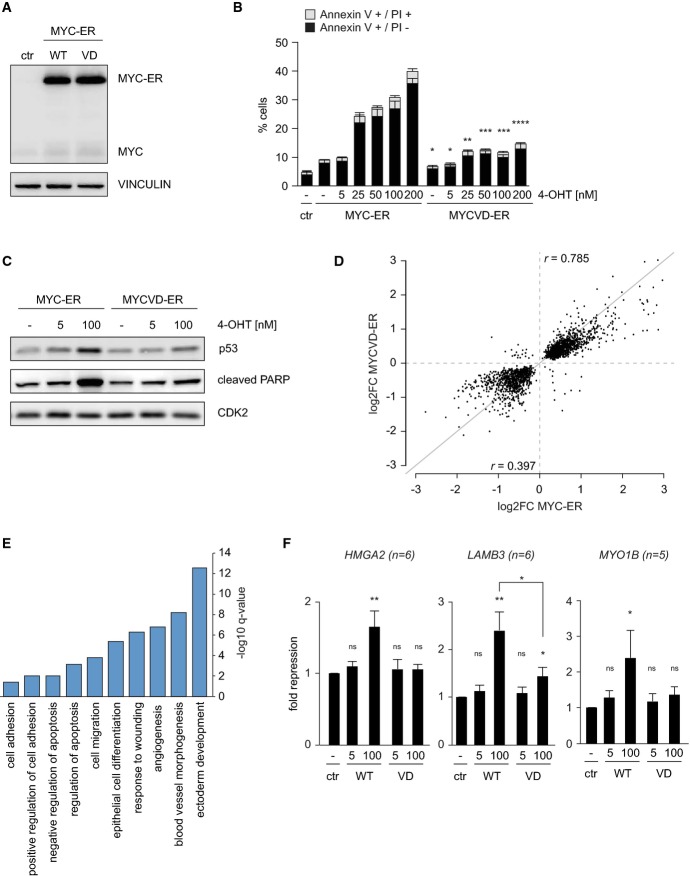
Immunoblot documenting levels of Myc and Myc-ER in pools of infected cells. MCF10A cells were infected with lentiviruses expressing Myc-ER or MycVD-ER under control of the SFFV promoter. Empty vector is termed ‘ctr’. Vinculin was used as a loading control (n = 3).
Induction of apoptosis by Myc-ER is dose and Miz1 dependent. FACS assays documenting the percentage of early (annexinV+/PI−) and late (annexinV+/PI+) apoptotic cells after incubation of MCF10A cells with the indicated concentrations of 4-OHT for 48 h. Error bars show standard deviation (n = 3). The symbols for P-values refer to the difference between Myc-ER and MycVD-ER and are calculated for the sum of apoptotic cells with a Student's t-test (*P ≤ 0.05; **P ≤ 0.01; ***P ≤ 0.001; ****P ≤ 0.0001).
High levels of Myc, but not of MycVD, induce p53 and cleavage of PARP. The panels show immunoblots of MCF10A-Myc-ER and MycVD-ER whole-cell lysates after culture in the presence of 5 nM or 100 nM 4-OHT for 24 h. Cdk2 is used as a loading control.
Summary of microarray analyses of gene expression in MCF10A-Myc-ER and MycVD-ER cells upon incubation with 100 nM 4-OHT for 24 h. The y-axis shows change in gene expression in response to MycVD-ER (4-OHT versus control); the x-axis shows changes induced by activation of Myc-ER for significantly regulated probe IDs (P < 0.05). Arrays were performed from triplicate biological samples (r indicates Pearson's correlation coefficient for activated or repressed genes, respectively).
GO-term analysis of genes that are repressed by Myc-ER (log2FC ≤ −0.5), but less by MycVD-ER (log2FC ≥ 0.5 for the difference between Myc-ER and MycVD-ER). The y-axis indicates significance as –log10
q-value (Benjamini); only significant GO-terms are shown.
qRT-PCR assays documenting repression of the indicated genes in response to incubation of MCF10A-Myc-ER and MycVD-ER cells with 5 nM or 100 nM 4-OHT for 24 h. The y-axis shows fold repression relative to control cells. Bars represent mean plus SEM of at least 5 independent biological experiments. P-values were calculated using a Student's t-test (ns: P > 0.05; *P ≤ 0.05; **P ≤ 0.01).

