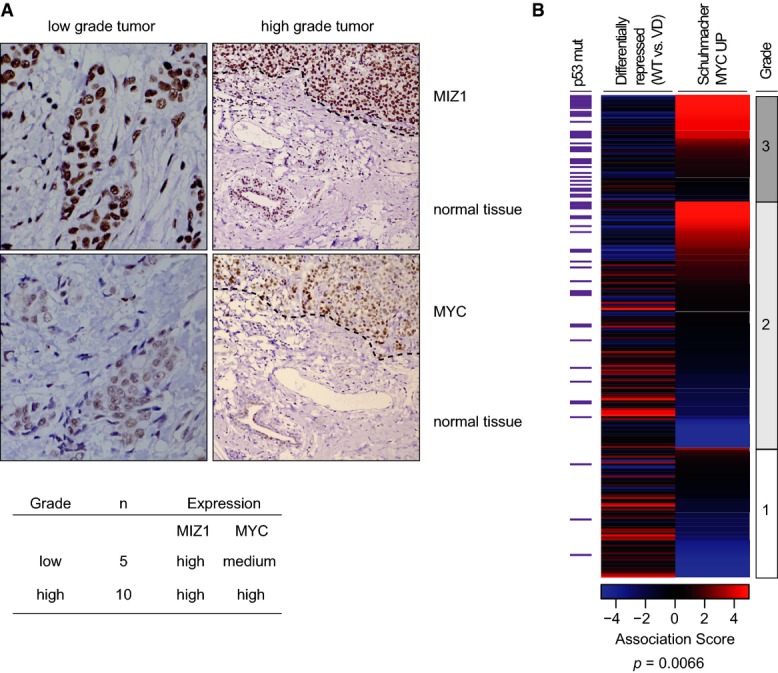
Figure 3.

- Left: Immunohistochemistry documenting levels of Miz1 and Myc in low-grade (400× magnification) and high-grade (triple negative, 200× magnification) breast cancer. Dashed lines in the right panels separate tumor from normal tissue. Representative examples are shown. Right: Table summarizing the results of all analyzed tumor cases.
- Heatmap of gene expression in mammary tumors. The graph shows association scores documenting similarity of gene expression in a given tumor to the indicated predefined gene sets: red color shows high expression (high association score); blue color indicates low expression of genes contained in a given gene set (low association score). Tumor grade and p53 mutation status are indicated on the sides of the heatmap. The P-value refers to the correlation of low levels of Myc/Miz1 repressed genes with p53 mutation status and was calculated with the use of a Fisher's exact test.
