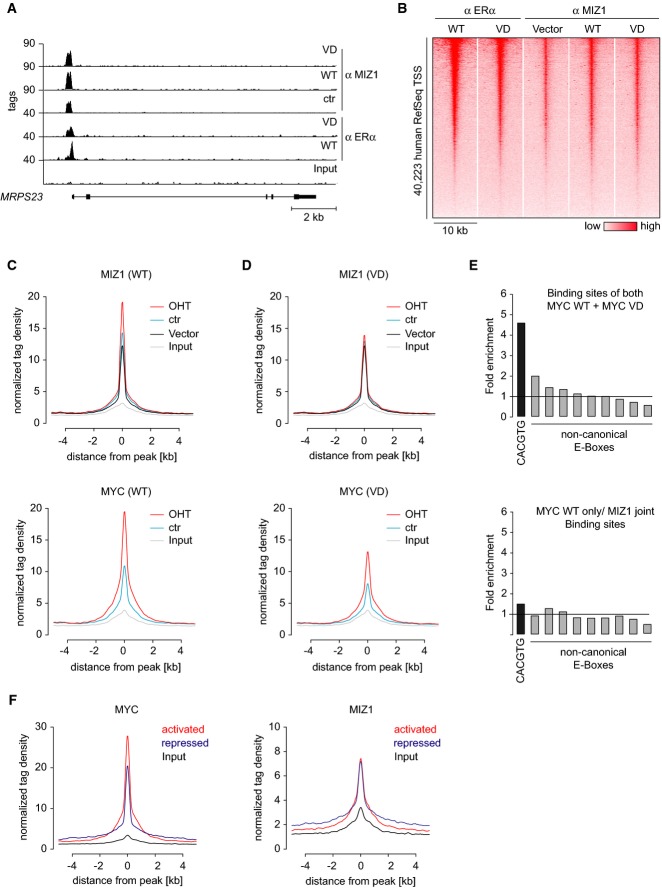
Figure 4.
- Example for ChIP-Sequencing tracks at the MRPS23 locus. ChIP-Seq was performed with the indicated antibodies from control MCF10A cells and from cells expressing either Myc-ER or MycVD-ER in the presence of 100 nM 4-OHT.
- Heatmap documenting binding of Myc-ER and endogenous Miz1 proteins to core promoters transcribed by RNA polymerase II at all human genes (UCSC RefSeq list) in a window of ±5 kb surrounding the transcription start site (TSS). Genes are ranked according to Myc occupancy.
- Distribution of Miz1 (top panel) and Myc-ER tags (bottom panel) in control cells (vector) and cells expressing Myc-ER in the presence or absence of 100 nM 4-OHT. Binding is shown for a window of ±5 kb around Miz1 peaks (found ±1.5 kb from a TSS) as reference coordinates.
- Distribution of Miz1 (top panel) and MycVD-ER tags (bottom panel) in control and MycVD-ER manipulated conditions. Binding is shown as in (C).
- Enrichment of consensus (CACGTG) and non-consensus (CANNTG) E-box sequences in binding sites that are bound by both Myc-ER and MycVD-ER (top panel) or in genes that are specifically bound only by Myc-ER jointly with Miz1 (bottom panel). The plots show enrichment over a defined background data set (Myc peaks in 4-OHT situation shifted by 500 bp).
- Occupancy of Myc-ER (left panel) and Miz1 (right panel) at Myc-activated and Myc-repressed genes in Myc-ER cells exposed to 100 nM 4-OHT.

