Figure 5.
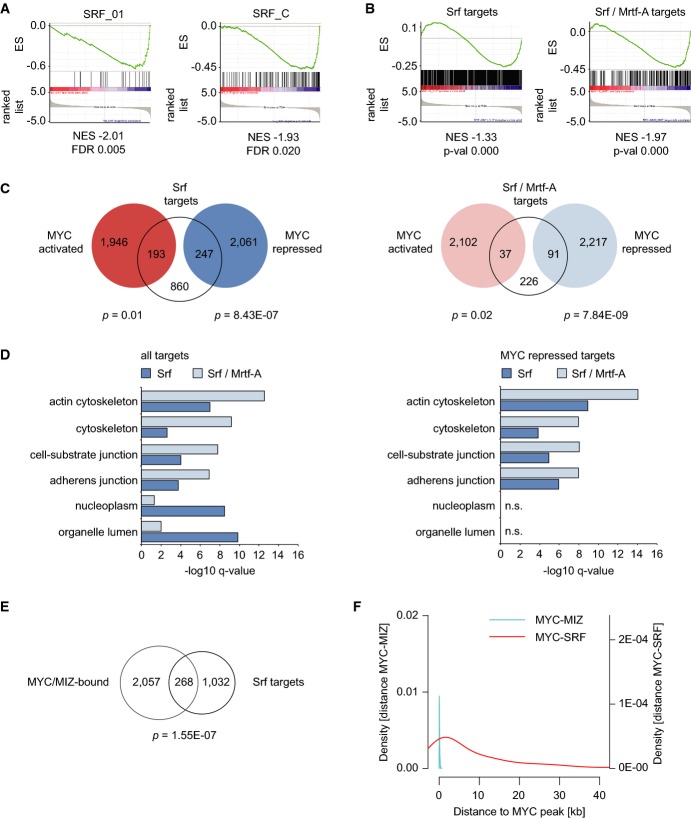
- Promoters of Myc-repressed genes contain SRF motifs. Example plots for two SRF gene sets found in the GSEA analysis of motif gene sets (C3, see Supplementary Fig S7A for a list). The analysis was performed comparing cells expressing Myc-ER versus MycVD-ER. For one of these sets, the genes regulated in response to induction of Myc-ER are included as red dots in Supplementary Fig S7B. ES = enrichment score; NES = normalized enrichment score; FDR = false discovery rate.
- Plots documenting repression of murine Srf and Mrtf-A targets by Myc-ER versus MycVD-ER. Direct target genes of Srf and Mrtf-A in MEFs were used to generate custom gene sets and subjected to GSEA analysis.
- Venn diagrams documenting overlap of Srf- (left panel) or Srf/Mrtf-A (right panel)-bound genes with Myc-ER-regulated genes. P-values show significance of overlap between target genes (based on hypergeometric distribution).
- GO-term analysis demonstrating functional categories of direct Srf/Mrtf-A target genes (left panel) or target genes overlapping with Myc-repressed genes (right panel).
- Venn diagram showing overlap of Srf-bound genes with genes bound by Myc-ER and Miz1 in cells expressing active Myc-ER. P-value shows significance of overlap between target genes (based on hypergeometric distribution).
- Myc/Miz1 and SRF bind independently from each other. The distance between SRF (MCF7 cells, GSM1010839) and Myc binding sites (peak middle) at repressed target genes is plotted as the density estimate of a histogram. The Myc/Miz complex is shown for comparison.

