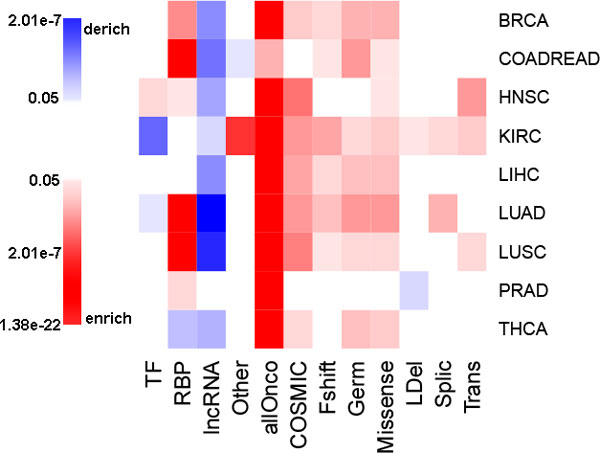
Figure 1.

Differential expression of different types of genes across cancers. The color represents p-values of enrichment analysis, which ranges from blue, which corresponds to derichment, to red at enrichment. The p-values that greater than 0.05 are colored as white. Fshift refers to frameshift, and Germ, LDel, Trans and Splic refers to germline, large deletions, translocations and splicing mutations respectively.
