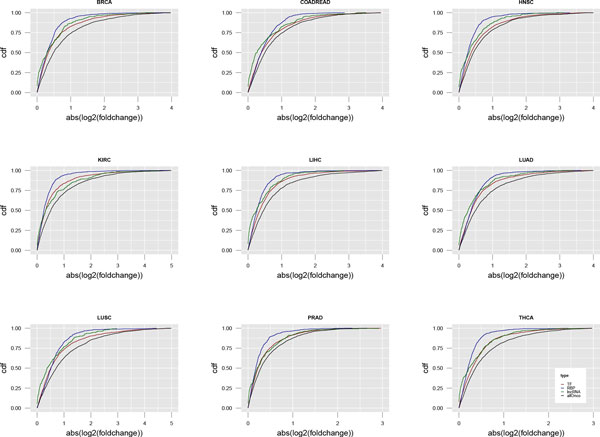
Figure 2.

Comparison of expression alterations between RBPs and other kinds of genes. Each of the 9 plots illustrate the cumulative distribution function (cdf) of expression change in tumor vs. normal across BRCA, COADREAD, HNSC, KIRC, LIHC, LUAD, LUSC, PRAD and THCA. The x-axis is the absolute value of log2 transformation of fold change.
