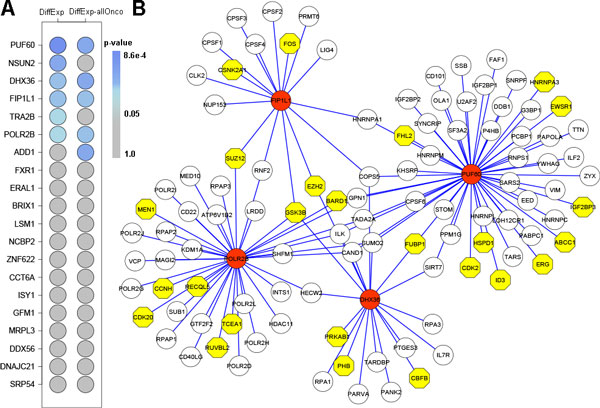
Figure 3.

Network of RBP-target interactions in LUSC. (A) Enrichment level of differentially expressed genes and allOnco in the targets of top 20 RBPs with highest fold change in LUSC. (B) PPI network comprising interactions between RBPs and differentially expressed targets in LUSC. The RBPs are those in top 20 and both differentially expressed genes and allOnco enriched in their interaction targets. RBPs are color coded as red, and their target allOnco are color coded as yellow.
