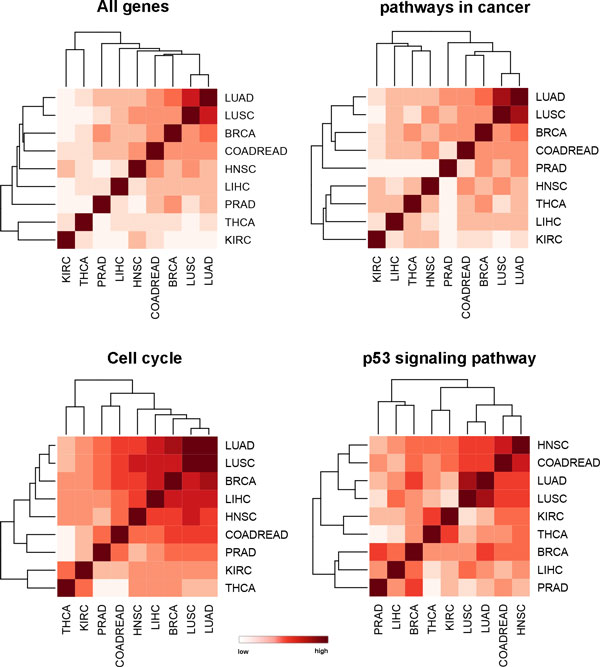
Figure 6.

Cancer type clustering by expression perturbation pattern of genes involved in different pathways. The four plots present clustering results by all expressed genes, genes involved in pathways in cancer, cell cycle and p53 signaling pathways respectively. The distance of two cancer types is measured by correlation of their expression fold change of involved genes.
