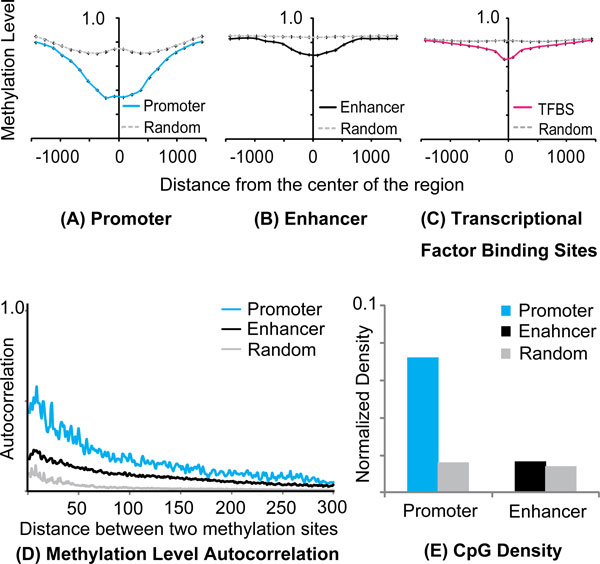
Figure 3.

The hypomethylation in regulatory regions extends a long range. (A-C) Average methylation level of mCpGs in regulatory regions and random regions. The regions were aligned on their center position. × axis is the distance from the center of the regions. Y axis is the average methylation level. (D) Autocorrelation between two mCpGs in regulatory regions and random regions. × axis is distance between two mCpGs. (E) CpG density of regulatory regions and random regions.
