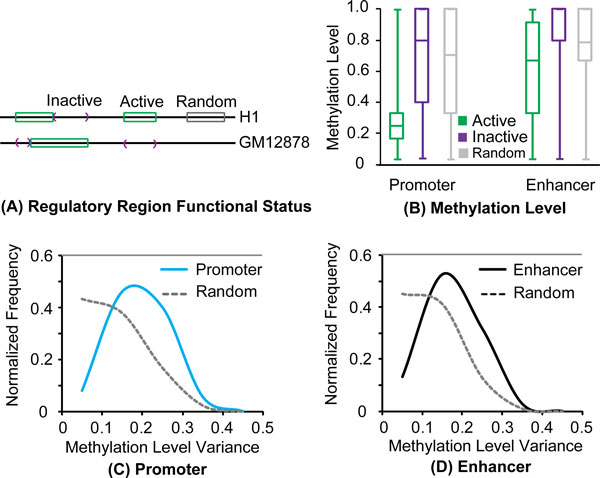
Figure 4.

Methylation level changes with the regulatory region status. (A) Functional status changes of a genomic region among different cells. A region can be active (green) in a cell (H1) while inactive (purple) in another cell (Gm12878). (B) Methylation level distribution of mCpGs inside of CpG islands in active, inactive and random regions. (C-D) Methylation level variance of mCpGs in regulatory and random regions among 15 cell lines.
