Figure 2.

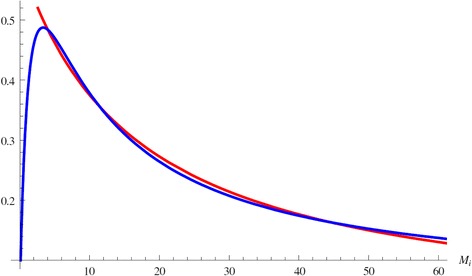
Multiple equilibria. Figure shows multiple intersections of the functions f (x) (in red) and g (x) (in blue). Each intersection gives one value of M i * and therefore one equilibrium.

Multiple equilibria. Figure shows multiple intersections of the functions f (x) (in red) and g (x) (in blue). Each intersection gives one value of M i * and therefore one equilibrium.