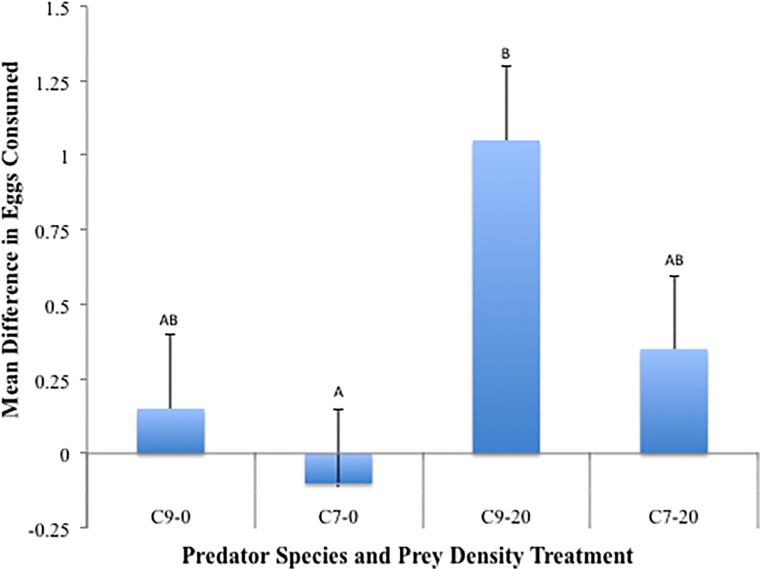
Fig 2. Mean difference in egg consumption.
Each bar represents mean (+SEM) difference in consumption per predator (C. novemnotata eggs—C. septempunctata eggs) for a single treatment combination across two factors, predator (C9 = C. novemnotata, C7 = C. septempunctata), and aphid density (0 or 20 pea aphids). A value of 0 represents no difference in consumption of the eggs of the two species. Columns with the same letter are not significantly different (p > 0.05).

