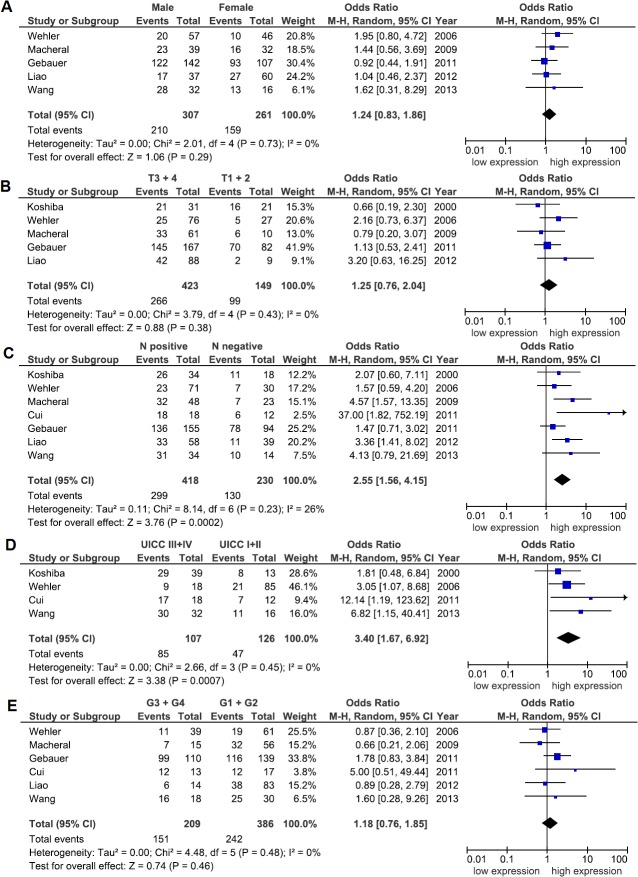
Fig 3. Association between CXCR4 and clinicopathological variables.
The Forest plot reflects the individual and pooled OR with CI for the relationship between expression of CXCR4 and (A) sex, (B) depth of invasion (T-stage), (C) lymph node metastasis (N-status), (D) UICC tumor stage or (E) grade of differentiation. Heterogeneity was verified by the Cochrane Q test (Chi-squared test; Chi2) and inconsistency (I2).

