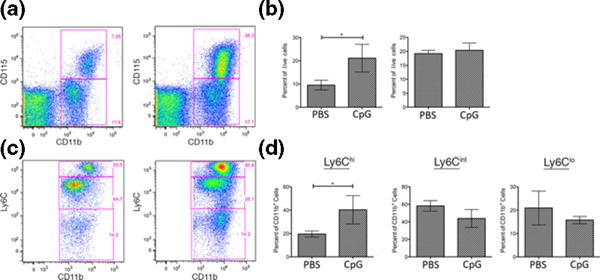
Figure 3.

Inflammatory monocytes are increased in the blood following CpGB DNA skin treatment. Flow cytometry analysis of peripheral blood mononuclear cells from 1 week PBS or CpGB DNA-treated mice, using CD11b-APC_Cy7, CD115-PE, Ly6C-Pacific Blue, and AmCyan Live/Dead cell staining. Data shown is gated on live cells. Representative images are shown in dot plots. (a) CD11b and CD115 staining, showing selection of CD11b+ CD115+ cells (monocytes) and CD11b+ CD115− cells (neutrophils) (b) Gating on CD11b+ cells, Ly6C staining, showing selection of Ly6Chi cells (inflammatory monocytes), Ly6Cint cells (neutrophils), and Ly6C− cells (patrolling monocytes). (c, d) Quantification of per cent positive cells for each population, n = 3. Data collected from one experiment. *P < 0.05.
