
Fig 6. Growth curve for ATG24 RNAi cell lines.
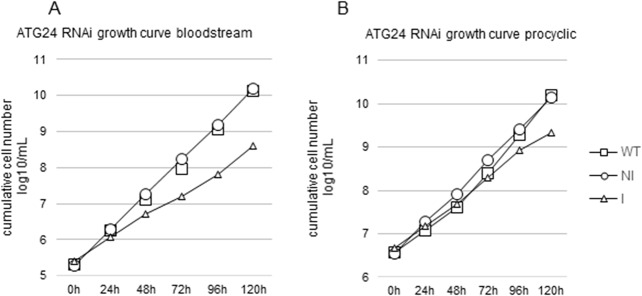
Minor growth inhibition by ATG24 silencing in T. brucei BSF (A) and PCF (B). Comparison of WT vs non-induced (NI) or induced (I) ATG24 RNAi cell line. WT–squares, NI–circles, I–triangles. Results are from one representative experiment out of three, giving the following population doubling times (PDT; mean ± SD): bloodstream-form wild-type cells 7.45 ± 0.61 h; ATG24 RNAi NI: 7.66 ± 0.48 h; ATG24 RNAi Ind: 11.51 ± 2.0 h. At 120 h the differences in PDT between BSF WT and ATG24 Ind and between ATG24 NI and ATG24 Ind are statistically significant with p-values of 0.012 in both cases, whereas the value for WT versus ATG24 NI is 0.708 and the difference thus not statistically significant. The PDT for procyclic trypanosomes are: WT, 9.16 ± 1.74 h; ATG24 RNAi NI, 10.17 ± 1.62 h; ATG24 RNAi Ind, 13.65 ± 3.6 h. At 120 h the p-value for differences in PDT of PCF WT versus ATG24 Ind is 0.204, ATG24 NI versus ATG24 Ind is 0.315, and WT versus ATG24 NI is 0.201; none of these differences is statistically significant.