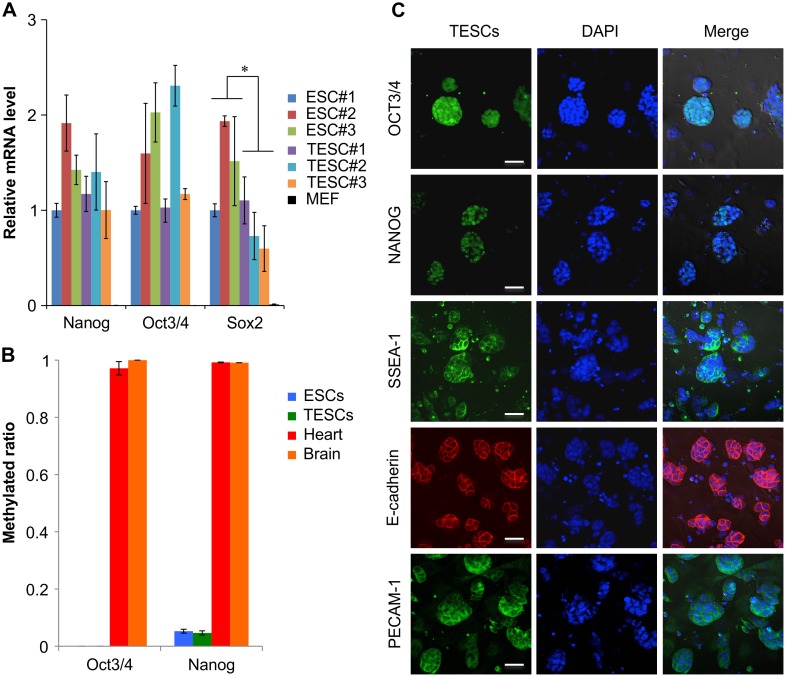
Fig 2. Expression and Epigenetic Analysis of TESCs.
(A) Relative expression of pluripotency markers by quantitative real-time RT-PCR analysis at passage 10. All data represent the mean and SEM (n = 3). *P < 0.05. (B) Analysis of DNA methylation profiles. DNA methylation levels in Oct3/4 and Nanog genes were determined by Bio-COBRA in TESCs and ESCs. All data represent the mean and SEM (n = 3). *P < 0.05. (C) Immunostaining of pluripotency markers. DAPI was used to stain DNA. A representative figure is shown. Scale bar, 50 μm.

