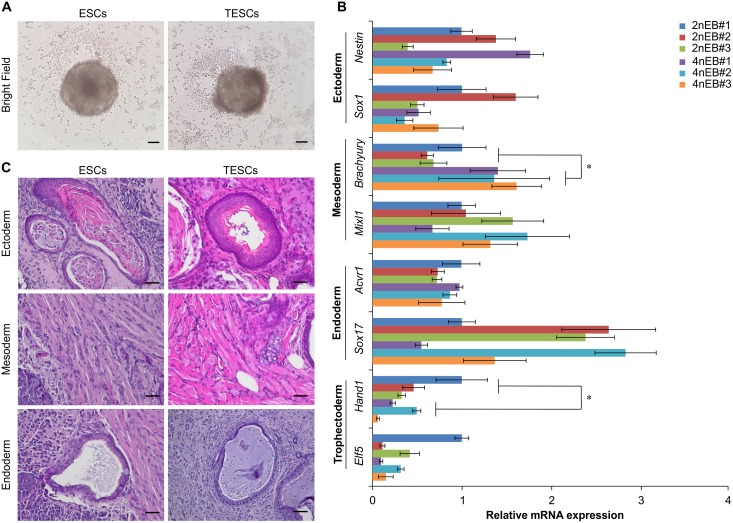
Fig 3. The Differentiation Potential of TESCs.
(A) Morphology of embryoid bodies generated from TESCs and ESCs. Scale bars, 100 μm. (B) Relative expression of various cell lineage marker genes in embryoid bodies generated from TESCs and ESCs by quantitative real-time RT-PCR analysis. All data represent the mean and SEM (n = 3). *P < 0.05. (C) Teratoma formation by TESCs. Scale bars, 50 μm.

