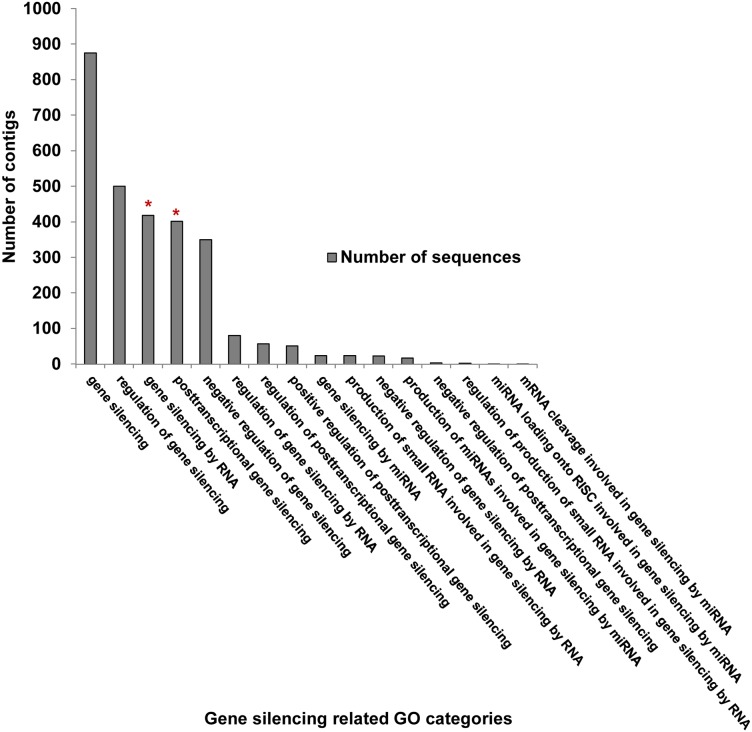
Fig 8. The differentially expressed gene silencing Gene Ontology (GO) categories.
GO categories represented on the x-axis were identified using selected search terms, as described in the Methods section. The number of ACP contigs was plotted by GO category on the primary axis, shown by the grey bars. Those with significantly different expression levels (P<0.05) are noted by a red asterisk above the grey bar. “Differential expression” was based on pairwise comparisons between Ca. Liberibacter asiaticus infected and uninfected ACP nymphs and adults.

