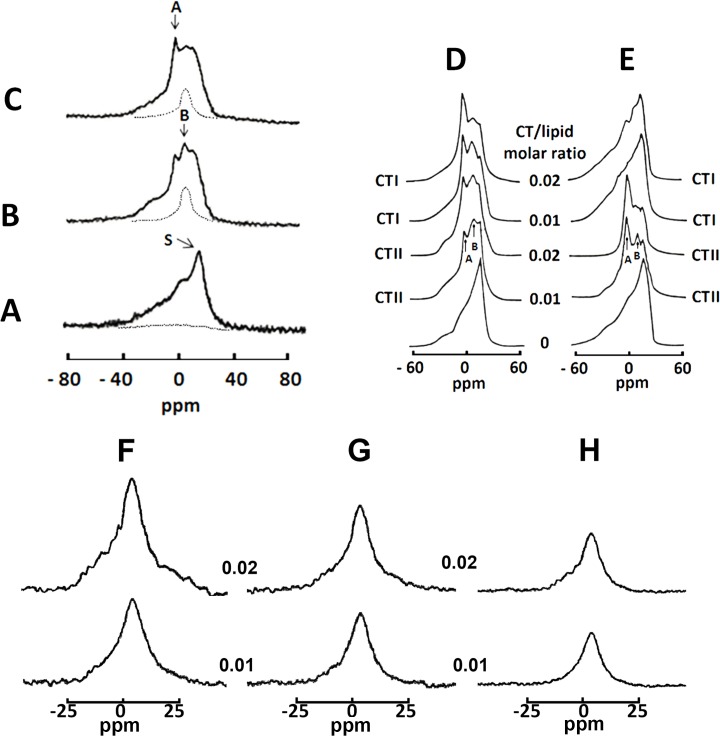
Fig 2. Effects of cobra venom cytotoxins CTII and CTI on isolated mitochondria and large unilamellar liposomes.
31P-NMR spectra of mitochondria or large unilamellar liposomes with different lipid compositions were monitored at 10°C. (A) 31P-NMR spectrum of a mitochondrial sample. (B) 31P-NMR spectrum of mitochondria treated with 9 × 10⁻⁴ M of CTII. (C) 31P-NMR spectrum of mitochondria treated with 9 × 10⁻⁴ M of CTI. Broken lines in A and B are saturation spectra observed after applying a DANTE train of saturation pulses at the high-field side of the lamellar spectrum (see arrow with letter S). 31P-NMR spectra of large unilamellar liposomes of PC+ 10 mol% CL (D) and of PC+ 10 mol% PS (E) monitored at 18°C and treated with the indicated cytotoxin-lipid ratios of CTII and CTI. All 31P-NMR data shown in this figure from isolated mitochondria and large unilamellar liposomes is representative of two independent experiments that showed similar results. Each sample was measured in triplicate readings. F-H. 31P-NMR spectra after applying a DANTE train of saturation pulses at the high-field peak of the lamellar spectrum of large unilamellar liposomes of PC+10 mol% CL treated with CTII (F) and CTI (G) and of PC+10 mol% PS treated with CTII (H) at the cytotoxin/lipid molar ratios of 0.01 (bottom spectra) and 0.02 (top spectra). Position of the signals in saturation spectra in F-H coincides with the position of 31P-NMR signal B.

