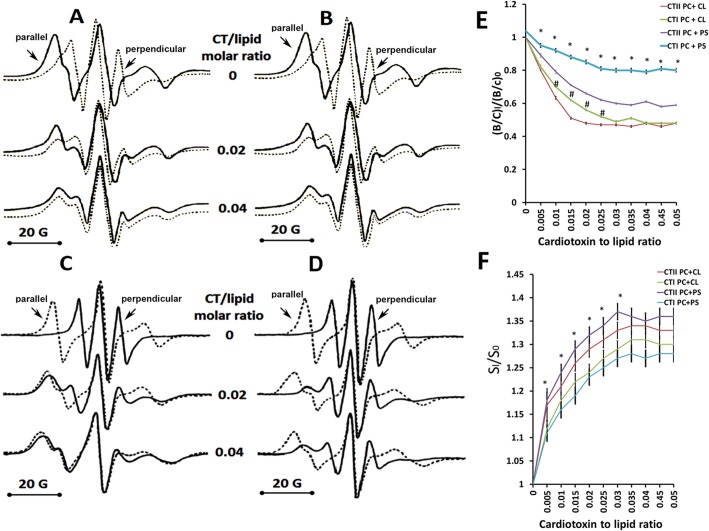
Fig 3. Effects of CTII and CTI on the orientation and organization of lipid bilayers.
EPR spectra of 5-DSA in oriented multibilayer films of PC+10 mol% CL (A, B) or in multibilayer films of PC+10 mol% PS (C, D) containing 5-DSA: lipid molar ratio of 1:100 at 18°C. The magnetic field that is parallel or perpendicular to the bilayer normal is indicated by arrows pointed at the respective EPR spectral lines. Multibilayer films were treated with CTII (A, C) or with CTI (B, D) at the indicated cytotoxin to lipid molar ratios. The graph shown in E represents the means and standard errors of the B/C ratios of the EPR spectra compiled from three independent experiments involving PC+ CL or PC+ PS multibilayer films treated or untreated with the indicated cytotoxins (*:P<0.05 for PC + PS/CTII vs. PC + PS/CTI, #:p<0.05 for PC + CL/ CTII vs. PC +CL/CTI). The graph shown in F represents the means and standard errors of the S parameters of the EPR spectra obtained from three independent experiments involving PC+ CL or PC+ PS multibilayer films treated or untreated with the indicated cytotoxins (*:P<0.05 for PC + PS/CTII vs. PC + PS/CTI). Values for (B/C)0 and S0 represent mean B/C and S values from lipids without cytotoxins and values for (B/C)I and SI represent mean B/C and S values from lipids treated at various cytotoxin to lipid molar ratios.

