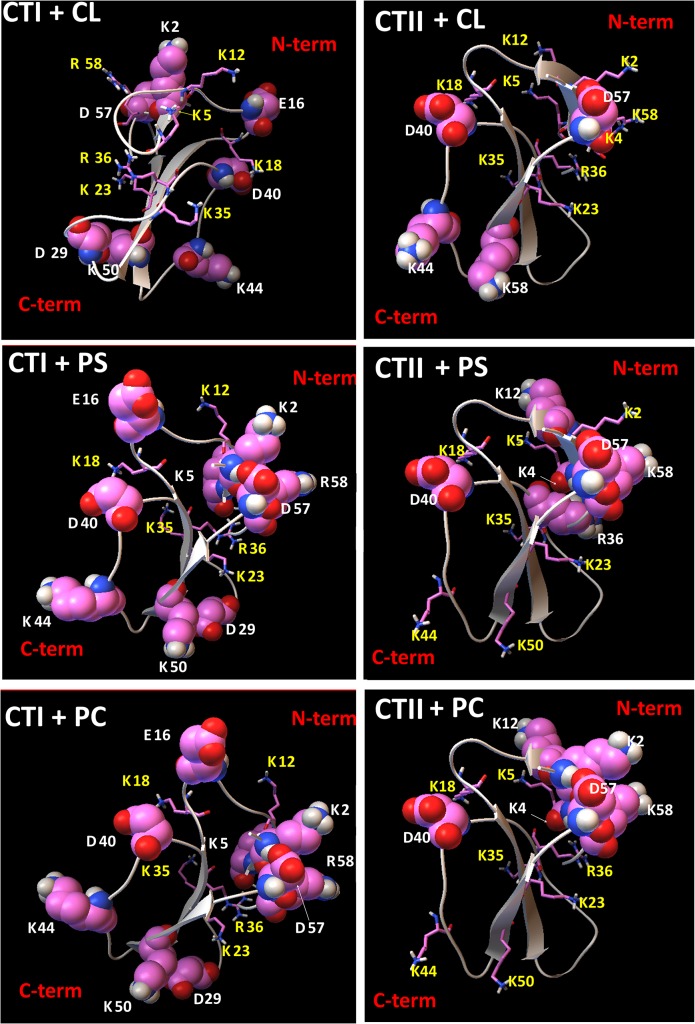
Fig 6. Visual summary of residues in cytotoxins that interact and do not interact with lipids.
Ribbon diagrams of CTI and CTII depicting the charged amino residues (ball and stick representations) that are predicted to interact with phospholipid head groups CL (top two panels), with PS (middle panels) or with PC (bottom two panels) based on the top ranked docking conformations identified by AutoDock simulations. Interacting charged amino acid residues are marked in yellow symbols and numbers and represented in stick mode. Charged amino acid residues in CTI and CTII that do not interact with PC, PS or CL are depicted in sphere mode representations and marked in white symbols and numbers. For a complete list of interactive residues and type of bonds produced with chemical groups of lipids. (S1, S2, S3, S4, S5, S6, S7, S8, and S9 Tables).

