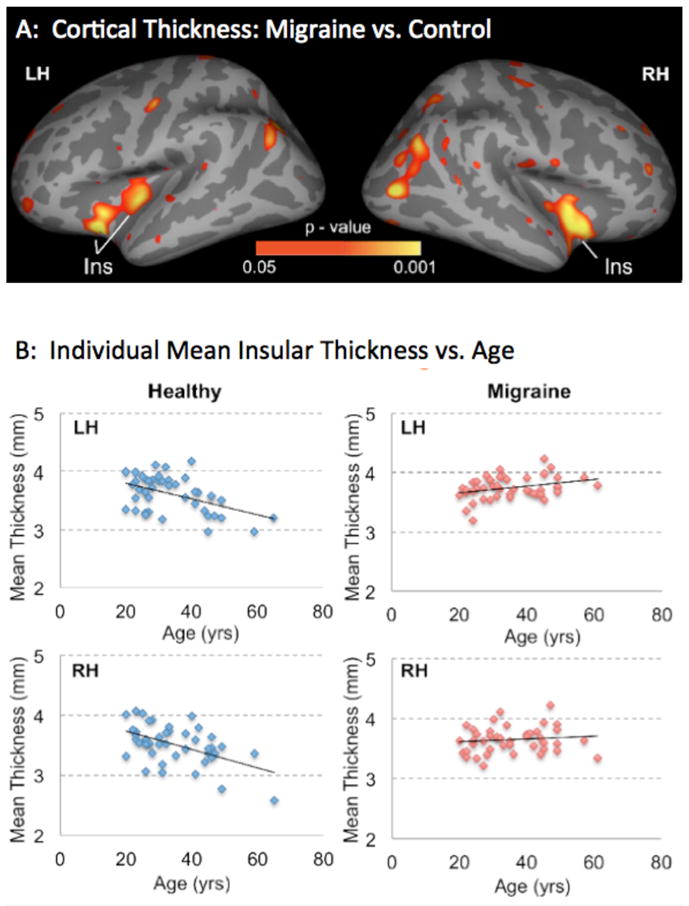
Figure 1. Cortical Thickness Maps.

A: Maps showing changes in cortical thickness in migraineurs vs. controls. Significant clusters from vertex-wise cortical thickness comparisons conducted on female migraineurs (N=46) vs. age- and gender- matched healthy control subjects (N=46) are shown. Clusters represent areas showing a significant difference in interaction between age and cortical thickness correlation between the two cohorts, with red-yellow clusters in insula showing regions that showed reduction (negative correlation) with age in healthy control subjects and no reduction in migraineurs. The results are Monte Carlo corrected for multiple comparisons. LH: Left Hemisphere; RH: Right Hemisphere; Ins: Insula.
B: Insula Thickness vs. Age in Migraineurs and Healthy Controls. Scatterplots of thinning in the insula regions identified by comparing migraineurs and healthy control subjects regressed by age. For these scatterplots, the z-statistic maps were thresholded at p < 0.01 and regions of interest were created in the insula of both hemispheres. The plots show the average cortical thickness values corresponding to each subject of each cohort that are plotted against the age.
