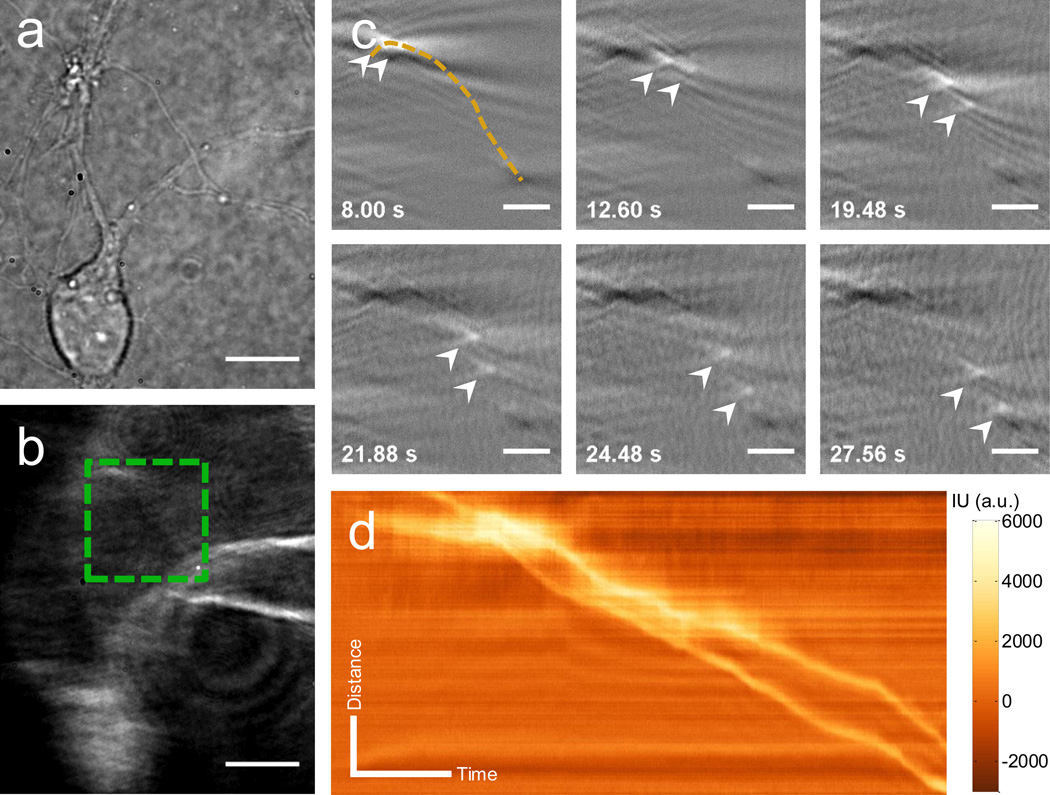
Figure 2. Plasmonic tracking of intracellular organelle dynamics in live cell.
Transmitted (a) and plasmonic (b) images of primary hippocampus neuron obtained by the plasmonic imaging system. (c) Snapshots of plasmonic images of the movement of two intracellular organelles along the neurite structure (marked as dashed line) in region marked by a dashed box in (b). (d) Kymograph of two organelles in (c). Scale bar: (a), (b), 10 µm; (c) 3 µm; (d) Distance: 3 µm; Time: 5 s.

