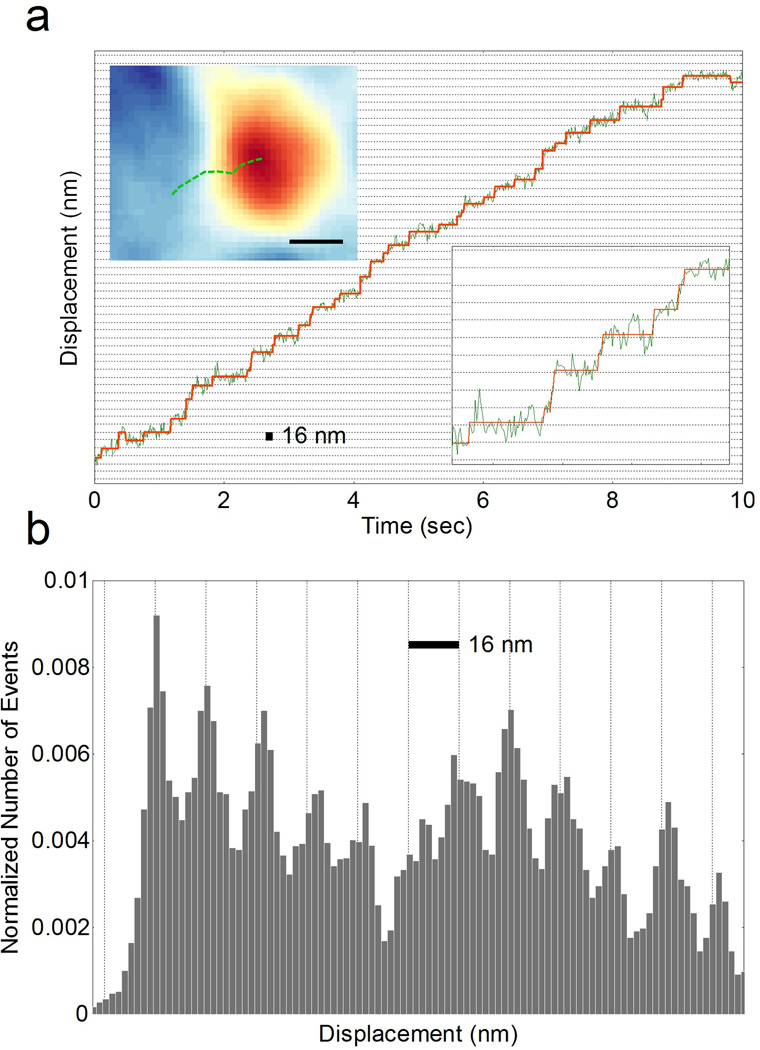
Figure 3. Stepping observation of single organelle.
(a) Green line: the trajectory of an organelle moving in cell over time. Red line: fitting of the trajectory with a stepwise function. Upper left inset: Trajectory of a moving organelle in x-y plane. Bottom right: zoom in of the trajectory between time 1.7 s and 3 s. (b) Pair-wised histogram of organelle displacement, showing discrete peaks with a separation of 16 nm. Scale bar: (a) Space between two horizontal grid line: 16 nm. Top inset: 400 nm (b) space between two vertical line: 16 nm.

