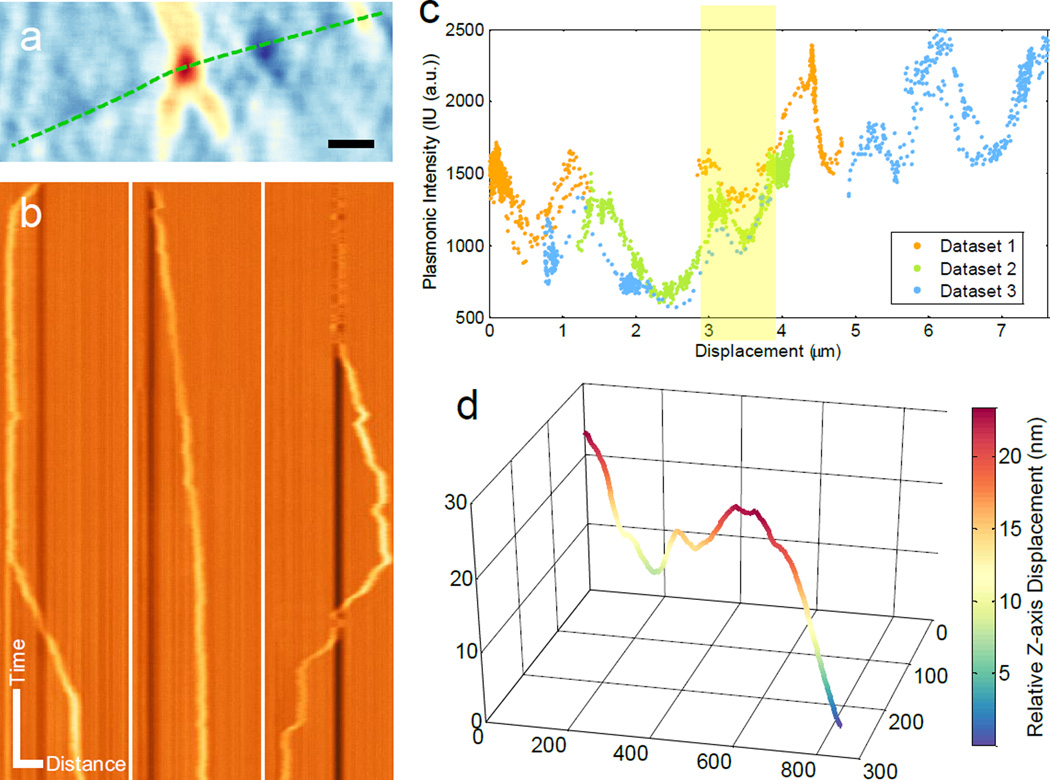
Figure 4. 3D mapping of microtubule structure by single organelle tracking.
(a) Trajectory of moving organelle in x-y plane. (b) Kymograph of three different runs of the same organelle. Vertical direction: time. Horizontal direction: distance. (c) Plasmonic image intensity variation of an organelle along its track. (d) 3D structure of microtubule bundle of the region highlighted with yellow shade in (c). Scale bar: (a) 1 µm (b) Time: 5 s; Distance: 2 µm.

