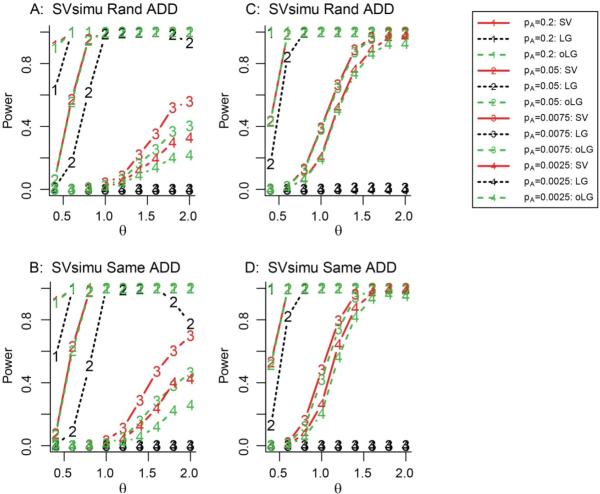
Figure 2. Power of SV method for the additive model using SVsimu simulation method.
Panels A and B show sample sizes of N=1000 (999) and 2500 (2499) for common and rare variants, respectively. Panels C and D show sample sizes of N=2000 (1998) and 5000 (5001) for common and rare variants, respectively. The solid, dotted and dash lines correspond to the SV, LG and oLG methods, respectively. The numbers of 1-4 correspond to the tested SNPs with MAFs of 0.2, 0.05, 0.0075 and 0.0025, respectively. The significance level of the test was 1×10⁻⁶.

