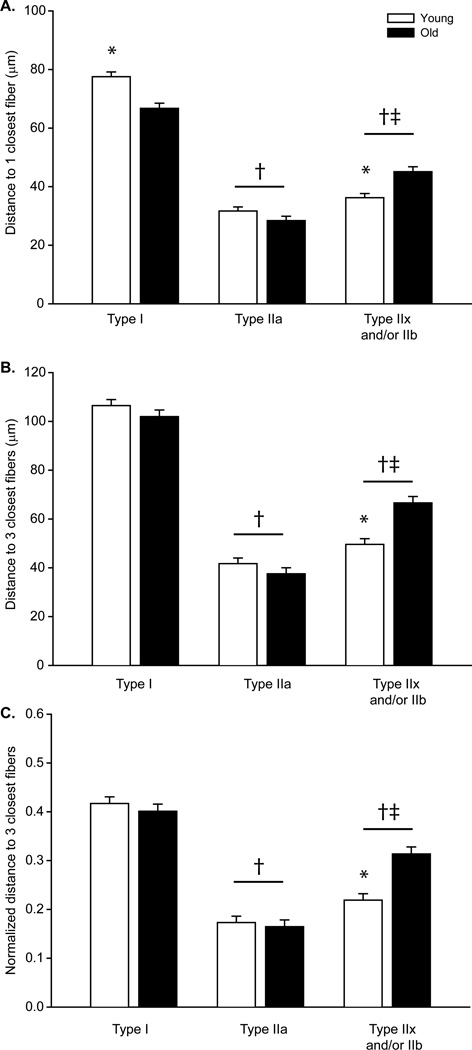
Figure 4.
The type dependent distance to fibers was determined for A) the closest individual fiber and B) the 3 closest fibers across ages. C) The distance to the 3 closest fibers dependent on fiber type was also normalized by the type specific average interfiber distance to account for the change in fiber type proportions with age. Data was analyzed with a mixed linear model with an individual animal as a random effect (age×fiber type×animal); there was a main effect of age and fiber type P<0.001.*significantly different than old age group of same fiber type; †significantly different than type I fibers; ‡significantly different than type IIa fibers.

