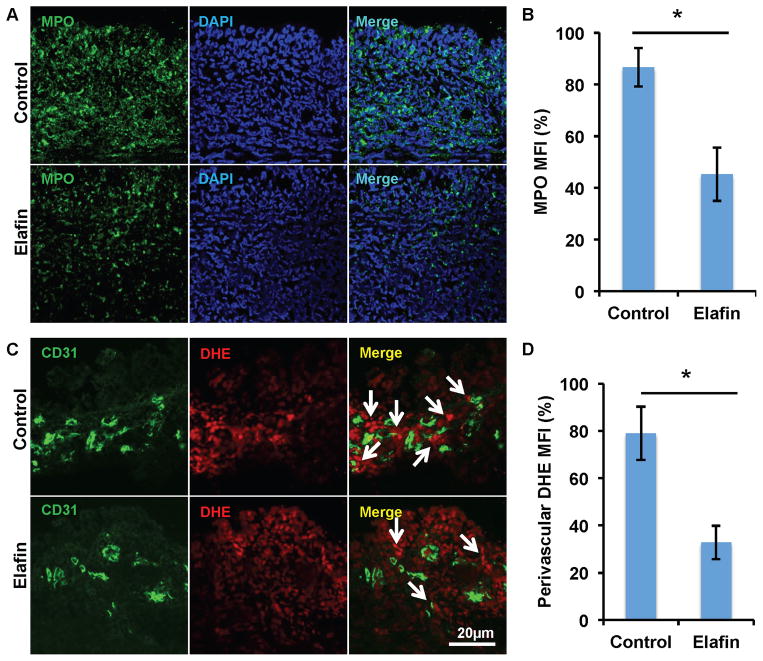
Figure 4. Elafin administration diminishes neutrophil infiltration and the production of perivascular ROS.
(A) Myeloperoxidase (MPO) staining showing decreased neutrophil infiltration into d8 transplants following elafin treatment. (B) Quantification of mean fluorescence intensity (MFI) of MPO staining (n=3–5 per group). (C) Detection of ROS by DHE staining showing decreased perivascular ROS production (white arrows) in elafin-treated allografts. (D) Quantification of perivascular MFI of DHE staining (n=3–5 per group). Scale bars, 20μm (A and C). Data are shown as mean±SEM. Student’s t test was used to compare groups. *P<0.05.

