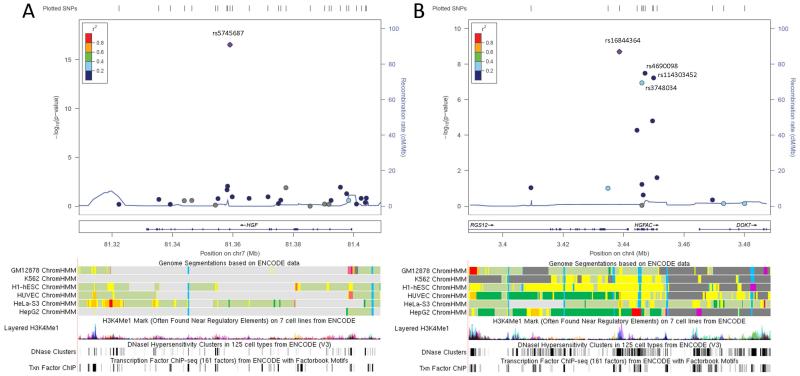
Figure 2. Regional association plots of meta-analysis results near rs5745687 and rs16844364.
LocusZoom association plots of the meta-analysis results in the neighborhood (+/− 50 Kb) of (A) rs5745687 and (B) rs16844364. Associated variant rs4690098 in proximity to rs16844364 is also labeled. LD patterns used for plotting are based upon 1000 Genomes European (March 2012) data. Corresponding regulatory annotation tracks from UCSC Genome browser include layered ENCODE H3K27Ac histone modifications, DNaseI hypersensitivity clusters, transcription factor ChIP-seq data, and Chromatin HMM state segmentations. The orange color for the chromatin segments indicates strong enhancer regions.

