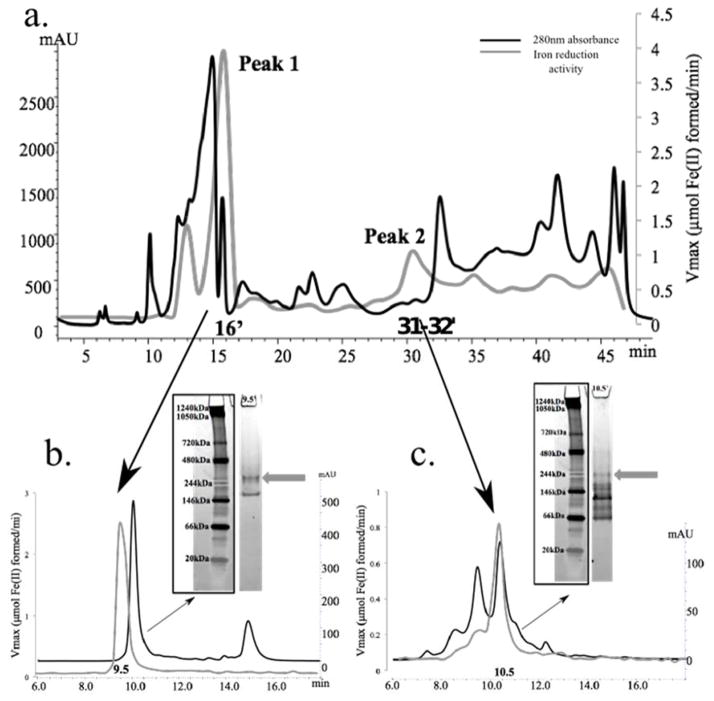
Figure 3. Identification of iron reduction activity in the soluble proteome of D. reducens.
Protein concentration (determined by absorbance at 280nm and presented as mAU) is represented by the black chromatogram, while the gray line presents an overlay of iron reduction activity (μmol Fe(II) formed/minute). 3.a. SAX separation of the soluble protein fraction led to the recovery of two dominant iron reduction peaks that are maintained through two subsequent dimensions of separation. 3.b. SEC separation of Peak 1 (SAX 16′ fraction) led to the recovery of iron reduction activity in fraction 9.5′. Further separation with native gel electrophoresis recovered an active iron reductase band (visualized as a pink band at ~280 kDa, designated by gray arrow). 3.c. SEC separation of Peak 2 (SAX 31–32′ fraction) led to the recovery of iron reduction activity in fraction 10.5′. Further separation with native gel electrophoresis recovered an active iron reductase band (visualized as a pink band at ~244 kDa, designated by gray arrow). SAX= strong anion exchange chromatography. SEC= size exclusion chromatography.

