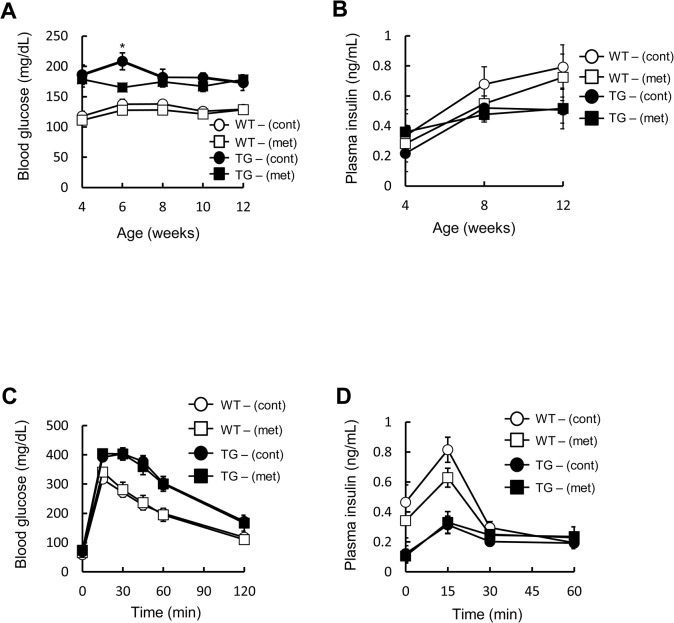
Fig 5. Effect of metformin on glucose tolerance in pancreatic beta cell-specific C/EBPβ TG mice.
A: Blood glucose levels and B: plasma insulin concentrations during the 8-week treatment period (n = 10–16 per group). C: Blood glucose levels and D: plasma insulin levels after an oral glucose load (1.5 mg/g body weight) following 8 weeks of metformin (met) treatment (n = 10–13 per group). *P < 0.05.

